
Page 54 - 南京医科大学自然版
P. 54
第44卷第7期
·938 · 南 京 医 科 大 学 学 报 2024年7月
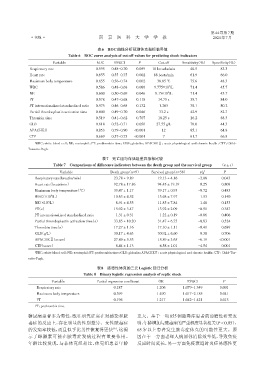
表6 ROC曲线分析预测休克指标临界值
Table 6 ROC curve analysis of cut⁃off values for predicting shock indicators
Variable AUC 95%CI P Cut⁃off Sensitivity(%) Specificity(%)
Respiratory rate 0.595 0.48-0.70 0.059 18 breaths/min 40.5 83.3
Heart rate 0.655 0.55-0.75 0.002 88 beats/min 61.9 66.0
Maximum body temperature 0.655 0.56-0.74 0.002 38.85 ℃ 75.6 48.3
9
WBC 0.586 0.48-0.68 0.086 9.775×10 /L 71.4 45.7
9
NE 0.600 0.50-0.69 0.046 8.15×10 /L 71.4 45.7
PT 0.578 0.47-0.68 0.118 14.75 s 35.7 84.0
PT internationalized standardized ratio 0.575 0.46-0.68 0.132 1.265 38.1 80.2
Partial thromboplastin activation time 0.600 0.49-0.70 0.046 33.2 s 42.9 82.7
Thrombin time 0.519 0.41-0.62 0.707 18.25 s 26.2 88.3
GLB 0.618 0.52-0.71 0.050 27.55 g/L 78.0 44.3
APACHEⅡ 0.853 0.79-0.90 <0.001 12 85.1 64.8
CTP 0.669 0.57-0.75 <0.001 7 61.7 66.8
WBC:white blood cell;NE:neutrophil;PT:prothrombin time;GLB:globulin;APACHEⅡ:acute physiological and chronic health;CTP:Child⁃
Turcotte⁃Pugh.
表7 死亡组与存活组差异指标比较
Table 7 Comparisons of difference indicators between the death group and the survival group (x ± s)
Variable Death group(n=9) Survival group(n=38) t/χ 2 P
Respiratory rate(breaths/min) 23.78 ± 9.890 19.13 ± 4.160 -2.08 0.043
Heart rate(beats/min) 92.78 ± 17.86 94.45 ± 19.19 0.25 0.808
Maximum body temperature(℃) 39.47 ± 1.170 39.17 ± 0.950 -0.72 0.483
WBC(×10 /L) 10.63 ± 4.520 13.68 ± 7.970 1.53 0.140
9
NE(×10 /L) 8.91 ± 4.55 11.85 ± 7.840 1.48 0.153
9
PT(s) 15.02 ± 3.470 13.92 ± 2.090 -0.91 0.387
PT internationalized standardized ratio 1.31 ± 0.31 1.22 ± 0.19 -0.86 0.406
Partial thromboplastin activation time(s) 33.85 ± 10.20 31.47 ± 6.750 -0.83 0.524
Thrombin time(s) 17.27 ± 1.160 17.10 ± 1.110 -0.41 0.689
GLB(g/L) 30.17 ± 4.630 30.92 ± 6.600 0.38 0.706
APACHEⅡ(score) 27.89 ± 5.530 15.89 ± 3.650 -6.19 <0.001
CTP(score) 8.44 ± 1.13 6.58 ± 1.01 -4.54 0.001
WBC:white blood cell;NE:neutrophil;PT:prothrombin time;GLB:globulin;APACHEⅡ:acute physiological and chronic health;CTP:Child⁃Tur⁃
cotte⁃Pugh.
表8 脓毒性休克的二元Logistic回归分析
Table 8 Binary logistic regression analysis of septic shock
Variable Partial regression coefficent OR 95%CI P
Respiratory rate 0.187 1.206 1.079-1.349 0.001
Maximum body temperature 0.399 1.490 1.017-2.185 0.041
PT 0.196 1.217 1.042-1.421 0.013
PT:prothrombin time.
糖尿病患者多为男性,既往研究证实在对感染和脓 更大。基于一项855例脓毒症患者的前瞻性研究表
毒症的反应上,存在明显的性别差异。女性脓毒症 明,年龄增加与脓毒症的严重程度显著相关(P < 0.05),
的发病率较低,而且似乎比男性恢复得更快 ,这揭 65 岁以上患者发生脓毒症休克的可能性更大。原
[8]
示了雌激素可能在脓毒症发病过程有重要作用。 因在于一方面老年人病原体清除效率低,导致免疫
年龄比较发现,与非休克组相比,休克组患者年龄 反应时间延长,另一方面免疫衰退时炎症易感性更