


Page 78 - 南京医科大学自然版
P. 78
第44卷第12期
               ·1692 ·                           南 京    医 科 大 学 学         报                        2024年12月


              用χ 检验进行评估。不符合正态分布的资料用中位
                 2
                                                                2 结     果
              数(四分位数)[M(P25,P75)]表示,组间比较采用非
              参数检验。受试者工作特征(receiver operating char⁃             2.1  患者特征
              acteristic,ROC)曲 线 和 曲 线 下 面 积(area under              本研究共纳入 290 例患者,其中 MAP 217 例
              curve,AUC)用于描述参数的预测作用。P < 0.05为                  (74.83% ),MSAP 68 例(23.45% ),SAP 15 例
              差异有统计学意义。                                        (5.17%)。表1总结了AP患者的特征。

                                                    表1 纳入患者的临床特征
                                          Table 1 Clinical characteristics of enrolled patients

                       Characteristics           MAP(n=217)             MSAP(n=69)             SAP(n=15)
                Age(years,x ± s)                 53.92 ± 16.80          54.96 ± 18.59          46.93 ± 15.24
                Sex(male/female,n/n)               141/76                  44/25                  9/6
                CRP(mg/L,x ± s)                  60.42 ± 21.28         140.65 ± 46.86 *       158.09 ± 91.32 *
                Lipase[U/L,M(P25,P75 )]       82.85(50.53,255.88)   135.10(40.13,414.28)   116.80(44.65,344.80)
                Amylase[U/L,M(P25,P75 )]     326.00(131.90,652.25)  427.50(288.68,868.75) *  626.10(152.00,806.50) *
                Calcium[mmol/L,M(P25,P75 )]     2.02(1.91,2.13)       1.96(1.80,2.10) *      1.91(1.81,2.05) *
                Glucose[mmol/L,M(P25,P75 )]     6.21(5.14,7.73)        6.40(5.27,8.33)       6.85(5.62,9.98) *
                T⁃Bil[μmol/L,M(P25,P75 )]     22.10(15.88,33.00)     30.40(20.27,54.93) *   29.40(17.05,48.08)
                ALT[mmol/L,M(P25,P75 )]       30.00(15.00,80.75)     60.50(17.75,170.75) *  73.00((24.00,155.50) *
                Albumin[g/L,M(P25,P75 )]      38.10(34.87,40.40)     34.65(32.70,39.02) *   35.10(31.50,39.25) *
                Creatinine[μmol/L,M(P25,P75 )]  69.00(56.00,80.25)   59.00(45.00,73.25) *   66.00(58.50,84.50)
                                     *
                 Compared with the MAP group,P < 0.05.
              2.2  NLR对AP严重程度的预测价值                              0.001)。NLR的cut⁃off值为13.38(灵敏度80.0%、特
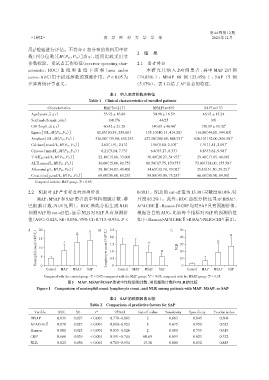
                  MAP、MSAP 和SAP患者的中性粒细胞计数、淋                     异度 83.2%)。此外,ROC 曲线分析还显示 BISAP、
              巴细胞计数、NLR 见图 1。ROC 曲线分析生成 NLR                     APACHEⅡ、Ranson和CRP均对SAP具有预测价值。
              预测 SAP 的 cut⁃off 值,显示 NLR 对 SAP 具有预测价             根据各自的AUC,比较每个指标对SAP的预测价值
              值(AUC:0.823,SE:0.056,95% CI:0.713~0.934,P <       如下:Ranson>APACHEⅡ>BISAP>NLR>CRP(表2)。

                  (×10 9 /L)  15  *               (×10 9 /L)  2.0    △              40               △     #
              A    20               △     #   B     2.5                         C   50

                                                                                    30
                  Neutrophil count  10 5          Lymphocyte count  1.0    #       NLR  20     *
                                                    1.5
                                                    0.5
                                                                                    10
                    0
                      Control  MAP  MSAP  SAP        0  Control  MAP  MSAP  SAP      0  Control  MAP  MSAP  SAP
                                           *
                                                                                                 #
                                                                     △
                     Compared with the control group,P < 0.05;compared with the MAP group,P < 0.05;compared with the MSAP group,P < 0.05.
                                图1   MAP、MSAP和SAP患者中性粒细胞计数、淋巴细胞计数和NLR的比较
                  Figure 1  Comparison of neutrophil count,lymphocyte count,and NLR among patients with MAP,MSAP,or SAP
                                                    表2  SAP的预测因素比较
                                          Table 2 Comparison of predictive factors for SAP

                 Varible    AUC     SE       P        95%CI      Cut⁃off value  Sensitivity  Specificity  Youden index
               BISAP       0.831   0.027   < 0.001  0.778-0.885      2         0.663      0.845       0.508
               APACHEⅡ     0.870   0.027   < 0.001  0.818-0.923      8         0.675      0.950       0.625
               Ranson      0.881   0.023   < 0.001  0.835-0.926      2         0.880      0.739       0.619
               CRP         0.668   0.039   < 0.001  0.591-0.744    60.65       0.699      0.623       0.322
               NLR         0.823   0.056   < 0.001  0.713-0.934    13.38       0.800      0.832       0.843

