
Page 22 - 南京医科大学自然版
P. 22
第45卷第10期
·1390 · 南 京 医 科 大 学 学 报 2025年10月
A B
SOX2 Merge
ddH2O/NTQ
IHC,Western blot,RT⁃qPCR
gavage
2.5 months 5×FAD
AD
4.0 months
2.5 months 6.5 months
AD+NTQ
50 μm
C D E F
3 *** 1.4 ** AD AD+NTQ 1.8 *
SOX2 -42 kDa
1.3 1.6
SOX2 + /DAPI mRNA SOX2 1.2 β⁃actin -42 kDa protein levels 1.4
2
1.1
1.2
1
1.0 SOX2 1.0
0 0.9 0.8
AD AD+NTQ AD AD+NTQ AD AD+NTQ
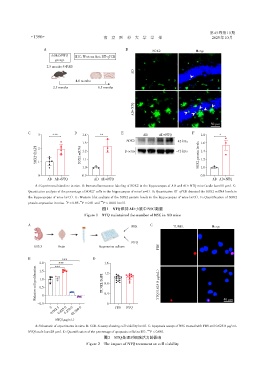
A:Experimental timeline in vivo. B:Immunofluorescence labeling of SOX2 in the hippocampus of AD and AD+NTQ mice(scale bar=50 μm). C:
+
Quantitative analysis of the percentage of SOX2 cells in the hippocampus of mice(n=6). D:Quantitative RT⁃qPCR detected the SOX2 mRNA levels in
the hippocampus of mice(n=3). E:Western blot analysis of the SOX2 protein levels in the hippocampus of mice(n=3). F:Quantification of SOX2
*
**
protein expression in mice. P < 0.05,P < 0.01 and *** P < 0.001(n=3).
图1 NTQ维持AD小鼠中NSC数量
Figure 1 NTQ maintained the number of NSC in AD mice
A C
PBS TUNEL Merge
NTQ
PBS
E15.5 Brain Suspension culture
B *** D
2.0 *** *** 1.6
Relative cell proliferation 1.0 TUNEL/DAPI 1.2 0 μg/mL) (0.625
1.5
0.8
0.5
0.4
-0.5 0 0 NTQ 40 μm
0.062 5 0.625 0 6.250 0 62.500 0
0 PBS NTQ
NTQ(μg/mL)
A:Schematic of experiments in vitro. B:CCK⁃8 assay showing cell viability(n=4). C:Apoptosis assays of NSC treated with PBS and 0.625 0 μg/ mL
NTQ(scale bar=20 μm). D:Quantification of the percentage of apoptosis cells(n=15). *** P < 0.001.
图2 NTQ处理对细胞活力的影响
Figure 2 The impact of NTQ treatment on cell viability