


Page 100 - 南京医科大学自然版
P. 100
第45卷第11期
               ·1630 ·                           南 京    医 科 大 学 学         报                        2025年11月


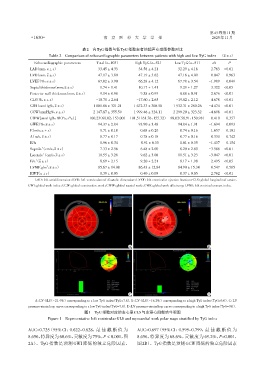
                                       表2 高TyG指数与低TyG指数患者的超声心动图参数对比
                        Table 2 Comparison of echocardiographic parameters between patients with high and low TyG index  (x ± s)
                 Echocardiographic parameters  Total(n=103)    High TyG(n=52)     Low TyG(n=51)    t/z    P
               LAD(mm,x ± s)                  33.45 ± 4.33       34.58 ± 4.21      32.29 ± 4.18   2.763  <0.01
               LVD(mm,x ± s)                  47.17 ± 3.80       47.19 ± 3.62      47.16 ± 4.00   0.047  <0.963
               LVEF(%,x ± s)                  67.02 ± 3.90       66.28 ± 4.12      67.78 ± 3.54  -1.989  <0.049
               Septal thickness(mm,x ± s)     0 9.74 ± 1.41      10.17 ± 1.41      0 9.29 ± 1.27  3.322  <0.05
               Posterior wall thickness(mm,x ± s)  0 9.14 ± 0.98  0 9.38 ± 0.99    0 8.88 ± 0.91  2.676  <0.01
               GLS(%,x ± s)                  -18.70 ± 2.64      -17.60 ± 2.65     -19.82 ± 2.12   4.678  <0.01
               GWI(mmHg%,x ± s)             1 801.06 ± 321.21  1 672.33 ± 308.58  1 932.31 ± 280.26  -4.474  <0.01
               GCW(mmHg%,x ± s)             2 147.87 ± 355.59  1 999.46 ± 324.11  2 299.20 ± 323.32  -4.698  <0.01
               GWW[mmHg%,M(P25,P75)]      100.23(60.02,153.00) 101.51(61.76,155.32) 98.02(58.91,150.98)  0.410  <0.357
               GWE(%,x ± s)                   94.37 ± 2.84       93.90 ± 3.48      94.84 ± 1.91  -1.694  <0.093
               E(m/s,x ± s)                   0 0.71 ± 0.18      0 0.68 ± 0.20     0 0.74 ± 0.16  -1.657  <0.101
               A(m/s,x ± s)                   0 0.77 ± 0.17      0 0.78 ± 0.18     0 0.77 ± 0.16  0.330  <0.742
               E/A                            0 0.96 ± 0.34     0 0.91 ± 0.33      0 1.01 ± 0.35  -1.437  <0.154
               Septale’(cm/s,x ± s)           0 7.33 ± 2.56      0 6.48 ± 2.00     0 8.20 ± 2.80  -3.586  <0.01
               Laterale’(cm/s,x ± s)          10.55 ± 3.28       0 9.62 ± 3.08     11.51 ± 3.23  -3.047  <0.01
               E/e’(x ± s)                    0 8.69 ± 2.15      0 9.20 ± 2.21     0 8.17 ± 1.98  2.495  <0.05
               LVMI(g/m ,x ± s)              0 85.67 ± 14.08    0 86.43 ± 12.84   0 84.90 ± 15.34  0.547  <0.585
                       2
               RWT(x ± s)                     0 0.39 ± 0.05     00 0.40 ± 0.050    0 0.37 ± 0.05  2.762  <0.01
                 LAD:left atrialdimension;LVD:left ventricularend diastolic dimension;LVEF:left ventricular ejection fraction;GLS:global longitudinal strain;
              GWI:global work index;GCW:global constructive work;GWW:global wasted work;GWE:global work efficiency;LVMI:left ventricular mass index.


                                                            A                                    B


                                                             C                                   D
                 A:LV GLS(-21.4%)corresponding to a low TyG index(TyG=7.8). B:LV GLS(-16.2%)corresponding to a high TyG index(TyG=9.0). C:LV
              pressure⁃strain loop curve corresponding to a low TyG index(TyG=7.8). D:LV pressure⁃strain loop curve corresponding to a high TyG index(TyG=9.0).
                                        图1 TyG指数对应的左心室GLS与左室心肌做功牛眼图
                       Figure 1  Representative left ventricular GLS and myocardial work polar maps stratified by TyG index

              AUC=0.725(95% CI:0.622~0.828,最 佳 截 断 值 为          AUC=0.697(95% CI:0.595~0.799,最 佳 截 断 值 为
              8.656,特异度为60.6%,灵敏度为75%,P < 0.001,图               8.656,特异度为 68.6%,灵敏度为 69.2%,P=0.001,
              2A)。TyG 指数是预测 GWI 降低的独立危险因素,                      图2B)。TyG指数是预测GCW降低的独立危险因素

