


Page 101 - 南京医科大学自然版
P. 101
第45卷第11期 陈 超,陶炜伟,陆美娟,等. 基于左心室整体纵向应变及心肌做功探讨甘油三酯⁃葡萄糖指数与亚临床左
                 2025年11月      心室功能障碍的相关性研究[J]. 南京医科大学学报(自然科学版),2025,45(11):1626-1633,1640 ·1631             ·


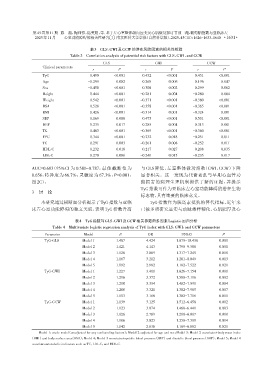
                                           表3 GLS、GWI及GCW的潜在风险因素的相关性检验
                                 Table 3 Correlation analysis of potential risk factors with GLS,GWI,and GCW
                                                 GLS                     GWI                     GCW
                     Clinical parameters
                                            r           P           r           P           r           P
                     TyG                   0.490      <0.001      -0.432      <0.001      -0.431      <0.001
                     Age                  -0.299       0.002       0.268       0.006       0.196       0.047
                     Sex                  -0.458      <0.001       0.308       0.002       0.299       0.002
                     Height                0.444      <0.001      -0.281       0.004      -0.280       0.004
                     Weight                0.542      <0.001      -0.371      <0.001      -0.380      <0.001
                     BSA                   0.528      <0.001      -0.358      <0.001      -0.365      <0.001
                     BMI                   0.426      <0.001      -0.314       0.001      -0.324       0.001
                     SBP                   0.169       0.088       0.475      <0.001       0.531      <0.001
                     DBP                   0.235       0.017       0.285       0.004       0.313       0.001
                     TG                    0.403      <0.001      -0.369      <0.001      -0.360      <0.001
                     FPG                   0.344      <0.001      -0.232       0.018      -0.251       0.011
                     TC                    0.291       0.003      -0.261       0.008      -0.252       0.011
                     HDL⁃C                -0.232       0.018       0.217       0.027       0.208       0.035
                     LDL⁃C                 0.270       0.006      -0.240       0.015      -0.235       0.017


                AUC=0.683(95%CI 为 0.580~0.787,最佳截断值为              与 GLS 降低、左室整体做功指数(GWI、GCW)下降
                8.656,特异度为 66.7%,灵敏度为 67.3%,P=0.001,              显著相关。这一发现为代谢紊乱与早期心血管功
                图2C)。                                             能损害的病理生理机制提供了新的证据,并提示
                                                                  TyG指数可作为亚临床左心室功能障碍的潜在生物
                3  讨 论
                                                                  标志物,具有重要的临床意义。
                    本研究通过横断面分析揭示了TyG指数与亚临                             TyG 指数作为胰岛素抵抗的替代指标,近年来
                床左心室功能障碍的独立关联,表明 TyG 指数升高                         已被多项研究证实与动脉粥样硬化、心肌肥厚及心

                                    表4 TyG指数与GLS、GWI及GCW相关参数的多因素Logistic回归分析
                         Table 4 Multivariate logistic regression analysis of TyG index with GLS,GWI,and GCW parameters
                      Parameter         Model           B            OR              95%CI              P
                      TyG⁃GLS          Model 1         1.487         4.424        1.875-10.438        0.001
                                       Model 2         1.421         4.143        1.790-9.588         0.001
                                       Model 3         1.128         3.089        1.317-7.245         0.010
                                       Model 4         1.167         3.212        1.281-8.049         0.013
                                       Model 5         1.092         2.982        1.182-7.522         0.021
                      TyG⁃GWI          Model 1         1.227         3.411        1.626-7.154         0.001
                                       Model 2         1.216         3.372        1.580-7.196         0.002
                                       Model 3         1.210         3.354        1.482-7.591         0.004
                                       Model 4         1.200         3.321        1.382-7.985         0.007
                                       Model 5         1.153         3.168        1.302-7.706         0.011
                      TyG⁃GCW          Model 1         1.139         3.125        1.512-6.458         0.002
                                       Model 2         1.123         3.074        1.468-6.441         0.003
                                       Model 3         1.026         2.789        1.280-6.007         0.010
                                       Model 4         1.106         3.023        1.250-7.309         0.014
                                       Model 5         1.042         2.836        1.169-6.882         0.021
                   Model 1:crude model(unadjusted for any confounding factors);Model 2:adjusted for age and sex;Model 3:Model 2 covariates+body mass index
               (BMI)and body surface area(BSA);Model 4:Model 3 covariates+systolic blood pressure(SBP)and diastolic blood pressure(DBP);Model 5:Model 4
                covariates+metabolic indicators such as TC,LDL⁃C,and HDL⁃C.

