


Page 102 - 南京医科大学自然版
P. 102
第45卷第4期
               ·538 ·                            南 京    医 科 大 学 学         报                        2025年4月


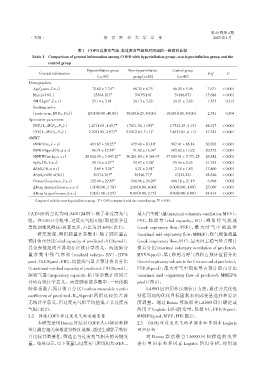
                                     表1 COPD过度充气组、非过度充气组和对照组的一般资料比较
                Table 1 Comparison of general information among COPD with hyperinflation group,non⁃hyperinflation group and the
                       control group

                                         Hyperinflation group  Non⁃hyperinflation  Control group
                   General information                                                           F/χ 2    P
                                             (n=39)           group(n=62)         (n=45)
              Demographics
                Age(years,x ± s)        0 0072.62 ± 7.74 *#  00068.32 ± 8.75  000 66.29 ± 5.06   7.671  < 0.001
                Male[n(%)]                  25(64.10) *#       59(95.16)          39(86.67)     17.688  < 0.001
                BMI(kg/m ,x ± s)         00023.14 ± 3.01   0 0024.13 ± 3.22   00 024.21 ± 3.02   1.555   0.215
                        2
                Smoking index
                [pack·year,M(P25,P75 )]   20.00(0.00,40.00)  30.00(6.25,40.00)  10.00(0.00,40.00)  2.381  0.304
              Spirometer parameters
                FEV1 [L,M(P25,P75 )]      1.27(1.03,1.49) *#  1.71(1.54,1.95) #  2.75(2.29,3.13)  88.917  < 0.001
                FVC[L,M(P25,P75 )]        2.30(1.89,2.97) *#  2.92(2.63,3.11) #  3.65(3.01,4.11)  47.223  < 0.001

              6MWT
                6MWD(m,x ± s)            00413.67 ± 50.25 *#  00479.40 ± 83.16 #  00 567.41 ± 66.14  50.705  < 0.001
                6MWD%pred(%,x ± s)      0  86.74 ± 12.54 #  00091.62 ± 16.34 #  00 105.82 ± 13.22  20.572  < 0.001
                6MWW(m·kg,x ± s)        28 662.45 ± 5 047.27 *#  36 261.80 ± 6 364.97  37 019.91 ± 5 771.25  26.342  < 0.001
                SpO2L (%,x ± s)         0 0090.74 ± 4.27 *#  0 0092.87 ± 3.28 #  00 095.56 ± 2.45  21.785  < 0.001
                ΔSpO2 (%,x ± s)         0 0005.69 ± 3.26 *#  0 0004.21 ± 2.91 #  000 02.16 ± 1.83  17.860  < 0.001
                ΔSpO2≥4%[n(%)]              29(74.36) *#       29(46.77) #        10(22.22)     22.826  < 0.001
                PRmax(beats/min,x ± s)  0 0122.46 ± 22.65 #  0 0116.98 ± 20.20 #  00 106.18 ± 21.19  6.596  0.002
                ΔBorg dyspnea(scores,x ± s)  1.00(0.00,3.50)  2.00(0.00,4.00)  0.00(0.00,1.00)  23.069  < 0.001
                ΔBorg fatigue(scores,x ± s)  2.00(1.00,3.25)  0.00(0.00,2.75)  0.00(0.00,0.00)  34.814  < 0.001
                                              *
                                                                          #
                 Compared with the non⁃hyperinflation group,P < 0.05;compared with the control group,P < 0.05.
              CAT≥10 的占比为 61.54%(24 例),高于非过度充气                  最大自主通气量(maximal voluntary ventilation,MVV)、
              组。在GOLD分组中,过度充气组E组(即症状多且                          FVC、肺 活 量(vital capacity,VC)、峰 值 呼 气 流 速
              急性加重风险高)患者更多,占比为25.64%(表2)。                      (peak expiratory flow,PEF)、最 大 呼 气 中 期 流 量
                  研究发现,两组肺量计参数中,除了肺活量占                         (maximal mid⁃expiratory flow,MMEF)、吸气峰值流量
              预计值百分比(vital capacity of predicted,VC%pred),     (peak inspiratory flow,PIF)、最大自主通气量占预计
              其余参数组间差异均存在统计学意义。两组肺分                             值百分比(maximal voluntary ventilation of predicted,
              量 参 数 中 残 气 容 积(residual volume,RV)、RV%           MVV%pred)、第 1 秒用力呼气容积占预计值百分比
              pred、TLC%pred、FRC、功能残气量占预计值百分比                   (forcedexpiratoryvolumeinthefirstsecondofpredicted,
             (functional residual capacity of predicted,FRC%pred)、  FEV1%pred)、最大呼气中期流量占预计值百分比
              深吸气量(inspiratory capacity,IC)等参数在组间差             (maximal mid ⁃ expiratory flow of predicted,MMEF%
              异均有统计学意义。而在肺弥散参数中,一氧化碳                            pred)(图1)。

              转移系数占预计值百分比(carbon monoxide tranfer                    LASSO 回归用作压缩估计方法,通过公式化包
              coefficient of predicted,KCO%pred)两组比较虽差异         括惩罚项的优化目标函数来完成变量选择和复杂
              无统计学意义,但过度充气组平均值低于非过度充                            度调整。通过 Boruta 算法联合 LASSO 回归确定最
              气组(表2)。                                           终用于 Logistic 回归的变量,包括 VC、FEV1%pred、

              2.2  筛选COPD伴过度充气的关键变量                             MMEF%pred、MVV、PIF(图2)。
                  本研究使用Boruta 算法对COPD 人口特征和肺                    2.3  COPD 伴过度充气的单因素和多因素 Logistic
              量计测定相关参数进行特征选择,通过生成影子特征                           回归分析
              并比较其重要性,筛选出与过度充气相关的关键变                                 对 Boruta 算法联合 LASSO 回归筛选的变量
              量。结果显示,以下变量与过度充气密切相关:FEV1、                        进行单因素和多因素 Logistic 回归分析,使用逐

