


Page 104 - 南京医科大学自然版
P. 104
第45卷第4期
               ·540 ·                            南 京    医 科 大 学 学         报                        2025年4月


              测 COPD 伴 过 度 充 气 ROC 曲 线 的 AUC 为 0.897              A      10 9 9 9 9 8 6 6 6 5 6 6 5 3 3 1 1
             (95%CI:0.836~0.957,P < 0.01),灵敏度为 0.846,特               1.4
              异度为0.790,提示该列线图模型具有较好的区分度                              1.3
                                                                    Binomial deviance  1.0
              和诊断效能(图4)。使用Bootstrap1000自抽样内部                         1.2
              验证,绘制该列线图模型的校准曲线,发现预测值                                 1.1


                                                                     0.9
                      FEV1
                                                     Important
                      MVV
                                                     Tentative       0.8
                      FVC
                                                     Unimportant
                       VC                                                   -8      -6       -4       -2
                                                     Shadow
                      PEF
                                                                                        logλ
                     MMEF
                       PIF                                        B
                                                                        MMEF   FEV1  MVV       MVV%pred  PIF
                 MVV%pred
                                                                        FVC    PEF   FEV1%pred  MMEF%pred  VC
                  FEV1%pred
                 MMEF%pred                                                   9       6       6       3
                                                                     2
                      BMI                                              6
                                                                       4 2
                  PEF%pred
                                                                     1
                  Shadowmax
                                                                       5
                       Sex                                           0  6 9
                                                                       10 7
                  FVC%pred
                Smoking index                                       -1
                   VC%pred                                         Coefficients
                  FEV1/FVC                                          -2
                       Age                                          -3
                 Shadowmean
              FEV1/FVC%pred                                         -4
                  Shadowmin
                                                                    -5  4
                         -5     0      5     10                             -8      -6      -4      -2
                                   Importance                                          logλ
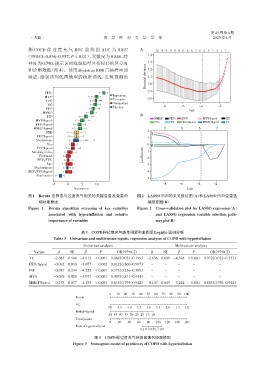
              图 1  Boruta 法筛选与过度充气相关的关键变量及变量的                   图2   LASSO回归的交叉验证图(A)和LASSO回归变量选
                   相对重要度                                             择路径图(B)
              Figure 1  Boruta algorithm screening of key variables  Figure 2  Cross⁃validation plot for LASSO regression(A)
                       associated with hyperinflation and relative       and LASSO regression variable selection path⁃
                       importance of variables                           wayplot(B)
                                       表3 COPD伴过度充气的单因素和多因素Logistic 回归分析
                          Table 3 Univariate and multivariate logistic regression analyses of COPD with hyperinflation
                                        Univariate analysis                       Multivariate analysis
                 Variate    β    SE     Z      P       OR(95%CI)       β    SE     Z      P       OR(95%CI)
               VC         -2.683 0.546 -4.912  < 0.001 0.068(0.023-0.199) -2.636 0.600 -4.394 < 0.001  0.072(0.022-0.232)
               FEV1%pred  -0.092 0.030 -3.077  0.002 0.912(0.860-0.967)  -   -     -      -           -
               PIF        -0.987 0.234 -4.225  < 0.001 0.373(0.236-0.589)  -  -    -      -           -
               MVV        -0.099 0.020 -5.073  < 0.001 0.905(0.871-0.941)  -  -    -      -           -
               MMEF%pred -0.153 0.037 -4.183  < 0.001 0.858(0.799-0.922) -0.147 0.045 -3.242  0.001  0.863(0.790-0.944)

                                                    0  10  20  30  40  50  60  70  80  90  100
                                    Points
                                    VC
                                                   5.0  4.5  4.0  3.5  3.0  2.5  2.0  1.5  1.0
                                    MMEF%pred
                                                   50 45 40 35 30 25 20 15 10
                                    Total points
                                                   0   20   40  60   80  100  120  140  160
                                    Risk of hyperinflation
                                                                  0.1 0.30.50.7 0.9
                                             图3  COPD伴过度充气预测因素列线图模型
                                   Figure 3  Nomogram model of predictors of COPD with hyperinflation

