


Page 77 - 南京医科大学自然版
P. 77
第45卷第4期            陈 讯,陈雯昕,张        文,等. 基于焦亡相关基因构建多囊卵巢综合征诊断模型[J].
                  2025年4月                      南京医科大学学报(自然科学版),2025,45(4):509-522                       ·513 ·


                因,构建预测 PCOS 发病率的列线图(图 3A)。每个                      置为 2 时,患者被很好地分为两个 Cluster(图 4A)。
                特征基因分配一个特定的得分区间,将所有基因的                            从累积分布函数(cumulative distribution function,
                得分汇总,计算最终得分,并与发病率进行比较。                            CDF)曲线在 0 ~ 0.2 波动可以看出,当 K=2 时,Clus⁃
                通过校准曲线评估列线图的预测准确性,实线和虚                            ters的稳定性最高(图4B)。另外,图4C说明了K值
                线的对齐越紧密,表明模型的准确性越高(图 3B)。                         2~9时的CDF曲线下的面积。值得注意的是,当K=
                此外,DCA 表明,黄线所代表的模型与所有曲线的                          2时,各亚型的一致性得分最大且最接近。因此,评
                距离显著较远,从而表明其在临床决策中的有效性                            估了 PRG 在 Cluster 1 和 Cluster 2 之间的表达差异,
               (图3C)。                                             以研究区分集群的分子特征。Cluster 1 中 CASP3、

                2.4  基于PRG的新亚型鉴定                                  CASP6 和 NLRP2 的表达水平较高,而 Cluster 2 中
                    使用47个差异表达的PRG,应用共识聚类算法                        CHMP2A、CHMP4B、白 介 素(interleukin,IL)1B、
                将 PCOS 患者分为不同的亚型。当 Clusters 变量设                   CASP9、GPX4、IL6、NLRC4、NLRP1、NLRP3、PYCARD


                  A                                     D
                       Model  XGB  RF   SVM  GLM                 GLM
                                                              BAX
                                                             GPX4
                    XGB
                                                            ELANE
                                                            CASP9
                                                           CHMP4B
                     RF
                                                            CHMP6
                                                           CHMP2A
                                                            CASP3
                    SVM
                                                            CASP8
                                                           CHMP4C
                    GLM                                          RF
                                                           CHMP4B
                       000   0.25  0.50  0.75  1.00         CHMP6
                                                           CHMP2A
                               Residual value
                  B                                         CASP8
                       Model  XGB   RF  SVM   GLM          CHMP4C
                                                            NLRC4
                    100                                      AIM2
                    (%)  90                                PRKACA
                                                            PLCG1
                     80
                                                             NOD2
                    Cumulative probability  60             PYCARD  SVM
                     70
                     50
                     40
                                                           CHMP2A
                     30
                                                            CASP3
                                                            CASP8
                     20
                     10
                                                             AIM2
                      0                                     NLRC4
                                                             NOD2
                        000  0.25  0.50  0.75  1.00
                                                            NLRP3
                                Residual value
                                                             BAK1
                  C
                      1.0                                      IL6
                                                                 XGB
                                                           CHMP4B
                      0.8
                                                           PYCARD
                                                            CASP3
                     Sensitivity                            NLRC4
                      0.6
                                                            NLRP2
                                                             AIM2
                      0.4
                                                            PLCG1
                                    RF:AUC=0.733              IL18
                      0.2                                   CASP1
                                    SVM:AUC=0.800
                                    XGB:AUC=0.867             TP63
                                    GLM:AUC=0.533
                       0                                         0.40     0.45    0.50     0.55    0.60     0.65
                        00   0.2  0.4  0.6  0.8  1.0                  Root mean square error(RMSE)loss after permutations
                                1-Specificity
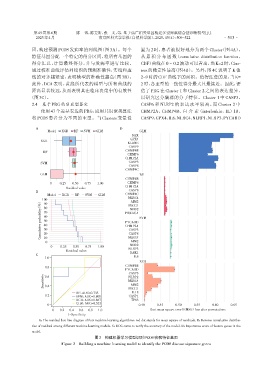
                   A:The residual box line diagram of four machine learning algorithms,red dot stands for mean square of residuals. B:Reverse cumulative distribu⁃
                tion of residual among different machine learning models. C:ROC curve to verify the accuracy of the model. D:Importance score of feature genes in the
                model.
                                             图2 构建机器学习模型识别PCOS疾病特征基因
                             Figure 2  Building a machine learning model to identify the PCOS disease signature genes

