


Page 81 - 南京医科大学自然版
P. 81
第45卷第4期            陈 讯,陈雯昕,张        文,等. 基于焦亡相关基因构建多囊卵巢综合征诊断模型[J].
                  2025年4月                      南京医科大学学报(自然科学版),2025,45(4):509-522                       ·517 ·


                胞无显著相关性(图7E)。                                     组 PCOS 患者和正常对照组人群血浆各 10 例,通过
                2.8  特征基因的细胞因子差异表达分析                              RT⁃qPCR 方法测定血浆中这 5 种特征基因表达水
                    细胞因子分析探讨模型基因与细胞因子表达                           平。结果显示 PYCARD、AIM2、CHMP4B 和 NLRP2
                之间的关系。AIM2 基因高表达组中,IL10、含细胞                       在PCOS患者组中的表达水平高于正常对照组,差异
                因子可诱导 SH2 蛋白(cytokine inducible SH2⁃con⁃          均有统计学意义(P < 0.05,图9A~D)。虽NLRC4在
                taining protein,CISH)、Toll 样受体 4(Toll⁃like recep⁃  PCOS 患者组中的表达量与正常对照组存在差异,
                tor 4,TLR4)表达水平较高,而 IL4 在低表达组中表                   但差异无统计学意义(图 9E)。这也进一步验证了
                达水平较高(图8A)。CHMP4B低表达组IL6ST表达                      XGB建立的预测模型具有可行性。

                水平较高(图 8B)。NLRC4 高表达组的 IL6 和 TNF
                                                                  3  讨 论
                表达水平升高(图 8C)。NLRP2 与 IL4 表达呈负相
                关,与 SOCS7 表达呈正相关(图 8D)。TGFB1、CISH                     PCOS 是育龄妇女最常见的内分泌疾病,其患
                与PYCARD的表达呈正相关(图8E)。                              病率为 5%~15% 。PCOS 的临床诊断和症状主要
                                                                                [1]
                2.9  人血浆中特征基因的表达量                                 包括慢性无排卵和高雄激素血症                [18] 。PCOS 的病因
                    为进一步验证以上生物信息分析结果,收集入                          尚不明确,但研究提示颗粒细胞(granulosa cell,GC)


                A               CHMP4B          Defense response  B    0.1         NLRC4
                   Running  enrichment score  0.3  Extracellular vesicle  Running  enrichment score  -0.1  Defense response
                                                                       0.0
                                                                                                  Immune response
                                                Immune response
                     0.2
                                                                                                  Response to biotic stimulus
                     0.1
                                                                      -0.2
                                                                      -0.3
                     0.0
                   Ranked  list metrie  -1 2 1 0                    Ranked  list metrie  -1 1 0
                      -2
                             300  600   900                                   200   400   600
                            Rank in ordered dataset                           Rank in ordered dataset
                C     0.0         NLRP2          Cell⁃cell adhesion  D    0.6        PYCARD       Cell activation
                   Running  enrichment score  -0.1  Ion transport       Running  enrichment score  0.4  Extracellular exosome
                                                                                                  Immune response
                                                 Regulation of leukocyte activation
                                                                                                  Inflammatory response
                     -0.2
                                                                          0.2
                                                                                                  Myeloid leukocyte activation
                     -0.3
                                                                          0.0
                     -0.4
                   Ranked  list metrie  -1 1 0                          Ranked  list metrie  -1 1 0
                             200   400   600                                     250  500  750  1 000
                             Rank in ordered dataset                             Rank in ordered dataset
                E                               F                                G                PYCARD
                                                                   NLRP2
                                CHMP4B                                                           Cell adhesion molecules
                                                                   Cytokine⁃cytokine             Chemokine signaling pathway
                                Diabetic cardiomyopathy            receptor interaction          Lysosome
                                Epstein⁃Barr virus infection  0.25  Hematopoletic cell lineage   Metabollc pathways
                                                                                                 Phagosome
                                                                   Metabolic pathways
                                Necroptosis
                  Running  enrichment score  0.5  Running  enrichment score  -0.25  Running  enrichment score  0.5
                     0.4
                                                                                      0.4
                                                      0.00
                     0.3
                                                                                      0.3
                                                                                      0.2
                     0.2
                                                                                      0.1
                     0.1
                                                     -0.50
                     0.0
                                                                                      0.0
                  Ranked  list metrie  -1 2 1 0   Ranked  list metrie  -1 1 0       Ranked  list metrie  -1 1 0
                     -2
                            300   600  900                    200   400   600                250  500   750  1 000
                           Rank in ordered dataset           Rank in ordered dataset         Rank in ordered dataset
                   A⁃D:GSEA⁃GO analysis of CHMP4B(A),NLRC4(B),NLRP2(C)and PYCARD(D). E⁃G:GSEA⁃KEGG analysis of CHMP4B(E),NLRP2(F),
                and PYCARD(G).
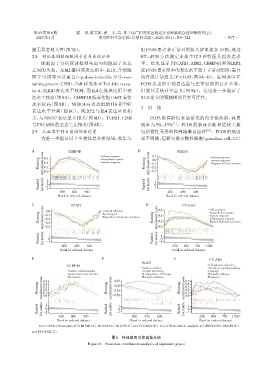
                                                     图6 特征基因功能富集分析
                                          Figure 6  Function enrichment analysis of signature genes

