


Page 90 - 南京医科大学自然版
P. 90
第45卷第4期
               ·526 ·                            南 京    医 科 大 学 学         报                        2025年4月


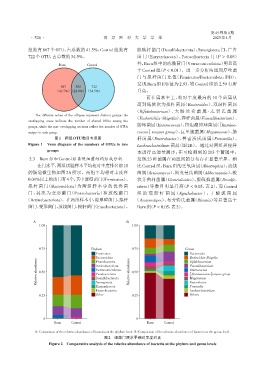
              组独有 867 个 OTU,占总数的 41.5%,Control 组独有              脱硫杆菌门(Desulfobacterota)、Synergistota 门、广古
              722个 OTU,占总数的34.5%。                               菌 门(Euryarchaeota)、Patescibacteria 门(P > 0.05)
                                                                外,Burn组中的疣微菌门(Verrucomicrobiota)明显高
                            Burn         Control
                                                                于Control 组(P < 0.01)。进一步分析两组间厚壁菌
                                                                门与拟杆菌门比值(Firmicutes/Bacteroidota,F/B),
                                                                发现 Burn 组 F/B 值为 2.93,较 Control 组的 2.59 有所
                             867    502    722
                           (41.5%)(24.0%)(34.5%)                升高。
                                                                     而在属水平上,相对丰度最高的 10 个菌属从
                                                                高到低依次为拟杆菌属(Bacteroides)、双歧杆菌属
                                                               (Bifidobacterium)、大 肠 埃 希 菌 属 ⁃ 志 贺 氏 菌 属
                 The different colors of the ellipses represent distinct groups,the
                                                               (Escherichia⁃Shigella)、粪杆菌属(Faecalibacterium)、
              overlapping areas indicate the number of shared OTUs among the
                                                                肠球菌属(Enterococcus)、扭矩瘤胃球菌属([Rumino⁃
              groups,while the non⁃overlapping sections reflect the number of OTUs
                                                                coccus]torques group)、巨单胞菌属(Megamonas)、肠
              unique to each group.
                          图1 两组OTU数目韦恩图                         杆菌属(Enterobacter)、普雷沃氏菌属(Prevotella)、
              Figure 1  Venn diagram of the numbers of OTUs in two  Lachnoclostridium 菌属(图 2B)。通过对两组粪便样
                       groups                                   本进行高通量测序,在可检测到的 203 个菌属中,

               2.3 Burn组和Control组粪便细菌结构组成分析                     发现 23 种菌属在两组间的分布存在显著差异。相
                  在门水平,两组试验样本平均相对丰度排名前10                        比Control组,Burn组的乏氧菌属(Abiotrophia)、放线
              的肠道微生物如图 2A 所示。两组平均相对丰度在                          菌属(Actinomyces)、阿克曼氏菌属(Akkermansia)、梭
              0.01%以上的菌门有4个,其中厚壁菌门(Firmicutes)、                 状芽孢杆菌属(Clostridioides)、脱硫弧菌属(Desulfo⁃
              拟杆菌门(Bacteroidota)为两组样本中的优势菌                      vibrio)等数目明显升高(P < 0.05,表 2),而 Control
              门,其次为变形菌门(Proteobacteria)和放线菌门                    组 的 琼 脂 杆 菌 属(Agathobacter)、丁 酸 弧 菌 属
             (Actinobacteriota)。在两组样本中,除厚壁菌门、拟杆                (Anaerostipes)、布劳特氏菌属(Blautia)等显著高于
              菌门、变形菌门、放线菌门、梭杆菌门(Fusobacteriota)、                Burn组(P < 0.05,表2)。


                A                                          B
                   1.00                                       1.00


                   0.75                    Phylum             0.75                     Genus
                                             Firmicutes                                  Bacteroides
                                             Bacteroidota                                Escherichia⁃Shigella
                  Relative abundance  0.50   Actinobacteriota  Relative abundance  0.50  [Ruminococcus]torques group
                                                                                         Bifidobacterium
                                             Proteobacteria
                                                                                         Faecalibacterium
                                                                                         Enterococcus
                                             Verrucomicrobiota
                                             Fusobacteriota
                                                                                         Megamonas
                                             Desulfobacterota
                                             Synergistota
                                                                                         Prevotella
                                             Euryarchaeota                               Enterobacter
                                             Patescibacteria                             Lachnoclostridium
                   0.25                      Other            0.25                       Others


                     0                                          0
                          Burn    Control                            Burn    Control
                 A:Comparison of the relative abundance of bacteria at the phylum level. B:Comparison of the relative abundance of bacteria at the genus level.
                                                 图2 细菌门属水平相对丰度对比
                       Figure 2  Comparative analysis of the relative abundance of bacteria at the phylum and genus levels

