


Page 93 - 南京医科大学自然版
P. 93
第45卷第4期         秦 浩,谢卫国,陈小红,等. 基于16S核糖体RNA高通量测序前瞻性分析50岁及以上重度
                  2025年4月         烧伤患者早期肠道菌群变化[J]. 南京医科大学学报(自然科学版),2025,45(4):523-534                   ·529 ·


                            A              r=0.060,P=0.015       B               r=0.146,P=0.019
                               0.6                                   300
                                                        Group
                                                          Burn
                                                          Control    250
                               0.3                                  (Bray⁃Curtis)  200
                              [10.2%]  0                             150


                              PCoA2                                  100

                               -0.3                                 Rank of distance  50


                               -0.6                                    0
                                       -0.3    0     0.3    0.6            Between   Burn    Control
                                           PCoA1[10.7%]

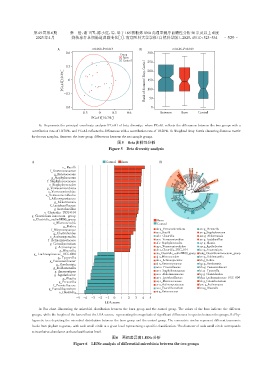
                   A:Represents the principal coordinate analysis(PCoA)of beta diversity,where PCoA1 reflects the differences between the two groups with a
                contribution rate of 10.70%,and PCoA2 reflects the differences with a contribution rate of 10.20%. B:Weighted Bray⁃Curtis clustering distance matrix
                for the two samples. Between:the inter⁃group differences between the two sample groups.
                                                       图5   Beta多样性分析
                                                   Figure 5  Beta diversity analysis


                A                                 Control  Burn            B
                              c_ Bacilli
                        f_Enterococcaceae
                          g_Enterococcus
                         g_Staphylococcus
                       f_Staphylococcaceae
                        o_Staphylococcales
                       p_Verrucomicrobiota
                       c_Verrucomicrobiae
                      o_Verrucomicrobiales
                        f_Akkermansiaceae
                          g_Akkermansia
                        f_Lactobacillaceae
                          g_Lactobacillus
                      o_Clostridia_UCG⁃014
                g_Clostridium innocuum _group
                o_Clostridic_vadinBB60_group                              Burn
                          o_Micrococcales                                 Control
                              g_Rothia
                         f_Micrococcaceae                                ab p_Verrucomicrobiota  au:g_Prevotella
                          g_Clostridioides                               ac c_Bacilli        av:g_Staphylococcus
                        o_Actinomycetales                                ad c_Clostridia     aw:g_Akkermansia
                       f_Actinomycetaceae                                ae c_Verrucomicrobiae  ax:g_Lactobacillus
                        g_Catenibacterium                                af c_Staphylococcales  ay:g_Blautia
                          g_Actinomyces                                  ag o_Verrucomicrobiales  az:g_Agathobacter
                             g_Olsenella                                 ah o_Clostridia_UCG_014  bc:g_Anaerostipes
                 g_ Lachnospiraceae_UCG⁃004                              aio_Clostridic_vadinBB60_group  bd:g_Clostridiuminnocuum_group
                            g_ Tyzzerella                                aj o_Micrococcales  be:g_Holdemanella
                        g_Fusicatenibacter                               ak o_Actinomycetales  bf:g_Rothia
                           g_Romboutsia                                  al o_Enterococcaceae  bg:g_Romboutsia
                          g_Holdemanella                                 am o_Prevotellaceae  bh:g_Fusicatenibacter
                          g_Anaerostipes                                 an o_Staphylococcaceae  bi:g_ Tyzzerella
                          g_Agathobacter                                 ao o_Akkermansiaceae  bj:g_Clostridioides
                              g_Blautia                                  ap o_Lactobacillaceae  bk:g_Lachnospiraceae_UCG_004
                            g_Prevotella                                 aq o_Micrococcaceae  bl:g_Catenibacterium
                          f_Prevotellaceae                               ar o_Actinomycetaceae  bm:g_Actinomyces
                        g_Faecalibacterium                               as o_Faecalibacterium  bn:g_Olsenella
                            c_Clostridia                                 at g_Enterococcus
                                    -5 -4  -3  -2  -1  0  1  2  3  4  5
                                                  LDA score
                   A:Bar chart illustrating the microbial distribution between the burn group and the control group. The colors of the bars indicate the different
                groups,while the lengths of the bars reflect the LDA scores,representing the magnitude of significant differences in species between the groups. B:Phy⁃
                logenetic tree depicting the microbial distribution between the burn group and the control group. The concentric circles represent different taxonomic
                levels from phylum to genus,with each small circle at a given level representing a specific classification. The diameter of each small circle corresponds
                to its relative abundance at that classification level.
                                                     图6 两组差异菌LEfSe分析
                                   Figure 6  LEfSe analysis of differential microbiota between the two groups

