


Page 92 - 南京医科大学自然版
P. 92
第45卷第4期
               ·528 ·                            南 京    医 科 大 学 学         报                        2025年4月


                                                       Burn(n=13)             Control(n=12)
                                      Actinomyces
                                      Agathobacter
                                      Akkermansia
                                      Anaerostipes
                                         Blautia
                                    Catenibacterium
                                      Clostridioides
                                      Enterococcus                                           Z⁃score
                                   Faecalibacterium                                            6
                                    Fusicatenibacter                                           4
                                     Holdemanella                                              2
                             Lachnospiraceae UCG⁃004                                           0
                                      Lactobacillus                                            -2
                                        Olsenella
                                        Prevotella
                                       Romboutsia
                                          Rothia
                                     Staphylococcus
                                        Tyzzerella
                          [Clostridium]innocuum group

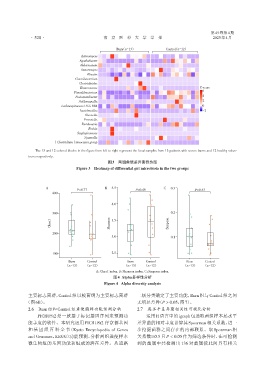
                 The 13 and 12 colored blocks in the figure from left to right represent the fecal samples from 13 patients with severe burns and 12 healthy volun⁃
              teers,respectively.
                                                   图3 两组粪便差异菌群热图
                                    Figure 3 Heatmap of differential gut microbiota in the two groups


                      A                          B   4.5                     C  0.3
                                     P=0.77                     P=0.49                     P=0.43
                         400
                                                     4.0

                         300                                                    0.2
                        Chao1                       Shannon  3.5               Simpson


                         200
                                                     3.0                        0.1


                         100                         2.5
                                 Burn    Control            Burn    Control            Burn     Control
                               (n=13)   (n=12)            (n=13)    (n=12)            (n=13)   (n=12)
                                             A:Chao1 index. B:Shannon index. C:Simpson index.
                                                     图4 Alpha多样性分析
                                                 Figure 4 Alpha diversity analysis

              主要标志菌群,Control 组以梭菌纲为主要标志菌群                       二级分类确定了主要功能,Burn组与Control组之间
             (图6B)。                                             无明显差异(P > 0.05,图7)。

              2.6  Burn组和Control组粪便菌群功能预测分析                     2.7  属水平差异菌相关性可视化分析
                  PICRUSt2 是一款基于标记基因序列来预测功                           运用R语言中的igraph包选取两组样本属水平
              能丰度的软件。本研究运用 PICRUSt2 行京都基因                       差异菌的相对丰度计算其Spearman相关系数,进一

              和 基 因 组 百 科 全 书(Kyoto Encyclopedia of Genes       步挖掘菌群之间存在的内部联系。取 Spearman 相
              and Genomes,KEGG)功能预测,分析两组粪便样本                    关系数≥0.5 且 P < 0.05 作为筛选条件时,在可检测
              微生物组的基因功能和组成的潜在差异。从通路                             到的菌属中共检测出 136 对菌属彼此间具有相关

