Page 20 - 南京医科大学自然版
P. 20

第45卷第6期
               ·758 ·                            南 京    医 科 大 学 学         报                        2025年6月
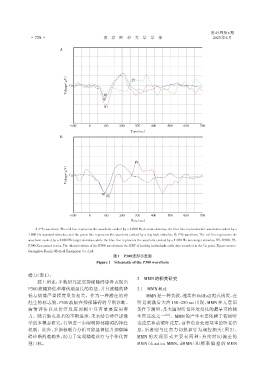

                             A


                                (μV)                          P3
                                Voltage  Cz

                                                 N1
                                                N1
                                                 N1


                                 -100     0      100    200    300     400    500     600    700
                                                             Time(ms)
                             B


                                                               P3
                                (μV)

                                Voltage  Cz


                                                N1
                                                  N1


                                 -100     0      100    200    300     400    500     600    700
                                                              Time(ms)

                 A:P3a waveform. The red line represents the waveform evoked by a 2 000 Hz deviant stimulus,the blue line represents the waveform evoked by a
              1 000 Hz standard stimulus,and the green line represents the waveform evoked by a dog bark stimulus. B:P3b waveform. The red line represents the
              waveform evoked by a 2 000 Hz target stimulus,while the blue line represents the waveform evoked by a 1 000 Hz non⁃target stimulus. N1:N100;P3:
              P300;Cz:central vertex. The characteristics of the P300 waveform in the ERP of healthy individuals,with data recorded at the Cz point. Figure source:
              Guangzhou Runjie Medical Equipment Co.,Ltd.
                                                     图1 P300波形示意图
                                              Figure 1 Schematic of the P300 waveform


              潜力(表1)。
                                                                2 MMN的相关研究
                  综上所述,多数研究证实抑郁障碍患者表现出
              P300波幅降低和潜伏期延长的特征,并且波幅的降                          2.1  MMN概述
              低与病情严重程度呈负相关。作为一种潜在的神                                  MMN是一种负波,通常由Oddball范式诱发,在
              经生物标志物,P300 波幅在抑郁障碍的早期诊断、                         听觉刺激后大约 150~250 ms 出现,MMN 在无意识
              病情评估以及治疗反应预测中具有重要应用潜                              条件下测量,是大脑对听觉环境变化的最早可检测
              力。随着脑电技术的不断进步,未来结合神经影像                            生理反应之一       [24] 。MMN 的产生主要依赖于初级听
              学的多模态研究,有望进一步阐明抑郁障碍的神经                            觉皮层和前额叶皮层,前者负责处理基本的听觉信
              机制。此外,多指标联合分析可能显著提升抑郁障                            息,后者则与注意力切换和行为调控相关(图 2)。
              碍诊断的准确性,助力于实现精准诊疗与个体化管                            MMN 的表现形式主要有两种:持续时间偏差的
              理目标。                                              MMN(duration MMN,dMMN)和频率偏差的 MMN
   15   16   17   18   19   20   21   22   23   24   25