


Page 97 - 南京医科大学自然版
P. 97
第45卷第7期          王 潇,王一帆,孙龙虎,等. 奶酪摄入与健康寿命终止风险的关联及其代谢机制研究[J].
                  2025年7月                     南京医科大学学报(自然科学版),2025,45(7):991-1000                       ·995 ·


               (续表1)
                    Characteristics                    HST(n=93 214)          Control(n=279 642)        P
                      Moderate                         32 533(34.90)            98 489(35.22)
                      Heavy                            41 561(44.59)           132 407(47.35)
                    IPAQ activity group[n(%)]                                                         <0.001
                      Low                              14 176(15.21)            37 965(13.58)
                      Moderate                         29 531(31.68)            93 131(33.30)
                      High                             29 581(31.73)            94 503(33.79)
                    Healthy diet[n(%)]                 58 070(62.30)           181 581(64.93)         <0.001
                    Carbohydrate intake[n(%)]                                                         <0.001
                      Low                              11 400(12.23)            38 796(13.87)
                      Moderate                         11 680(12.53)            40 836(14.60)
                      High                             12 292(13.19)            41 873(14.97)
                    Protein intake[n(%)]                                                              <0.001
                      Low                              11 354(12.18)            39 131(13.99)
                      Moderate                         11 745(12.60)            41 181(14.73)
                      High                             12 273(13.17)            41 193(14.73)
                    Fat intake[n(%)]                                                                  <0.001
                      Low                              11 551(12.39)            39 537(14.14)
                      Moderate                         11 713(12.57)            41 077(14.69)
                      High                             12 108(12.99)            40 891(14.62)
                      Unknown                          57 842(62.05)           158 137(56.55)
                    Fiber intake[n(%)]                                                                <0.001
                      Low                              11 495(12.33)            38 406(13.73)
                      Moderate                         11 654(12.50)            40 740(14.57)
                      High                             12 223(13.11)            42 359(15.15)
                    Aspirin/ibuprofen used[n(%)]       23 375(25.08)            63 393(22.67)         <0.001
                    CLM used[n(%)]                      6 272(6.73)             14 388(5.15)          <0.001
                    Have family cancer[n(%)]           34 667(37.19)           100 693(36.01)         <0.001
                    Have family CCVD[n(%)]             54 753(58.74)           160 357(57.34)         <0.001
                   HST:healthspan terminated;BMI:body mass index;Townsend:Townsend deprivation index;IPAQ:international physical activity questionnaire;
                CCVD:Cardiovascular and cerebrovascular diseases;CLM:Cholesterol lowering medication. The Mann⁃Whitney test was used to calculate whether the
                distribution of continuous variables was statistically different between the two groups. The Chi⁃squared test was used to calculate whether the distribu⁃
                tion of categorical variables was statistically different between the two groups.


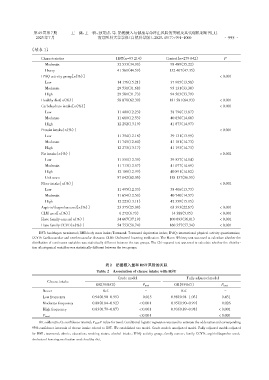
                                                  表2 奶酪摄入量和HST风险的关联
                                              Table 2 Association of cheese intake with HST

                                                       Crude model                     Fully adjusted model
                       Cheese intake
                                             OR(95%CI)             Ptrend        OR(95%CI)             Ptrend
                     Never                      Ref.                -                Ref.                -
                     Low frequency          0.94(0.90-0.99)        0.015        0.98(0.94-1.03)        0.431
                     Moderate frequency     0.88(0.84-0.92)      <0.001         0.95(0.90-0.99)        0.026
                     High frequency         0.83(0.79-0.87)      <0.001         0.93(0.89-0.98)       <0.001
                                                                 <0.001                               <0.001
                     Ptrend
                   OR:odds ratio;CI:confidence interval;Ptrend:P value for trend. Conditional logistic regression was used to estimate the odds ratios and corresponding
                95% confidence intervals of cheese intake related to HST. We established two model. Crude model:unadjusted model. Fully adjusted model:adjusted
                for BMI,townsend,ethnic,education,smoking status,alcohol intake,IPAQ activity group,family cancer,family CCVD,aspirin/ibuprofen used,
                cholesterol lowering medication used,healthy diet.

