


Page 98 - 南京医科大学自然版
P. 98
第45卷第7期
               ·996 ·                            南 京    医 科 大 学 学         报                        2025年7月


                                                                             OR((95%CI))  P P
                                  126 242(75.52%)
                1.2                                    128 000
                                               OR 95%CI         Cancer((n=50 679))
                                                                 Never       Ref.
                                               HST
                                                                 Low frequency  1.04(0.97-1.11) 0.269
                                               Control           Moderate frequency  1.02(0.96-1.09) 0.505
                          101 908(74.18%)
                                              Ptrend<0.001       High frequency  1.01(0.94-1.09) 0.754
                                                       100 000
                1.1                                             MI(n=16 032)
                                                                 Never       Ref.
                                                                 Low frequency  0.92(0.83-1.03) 0.146
                                                       80 000    Moderate frequency  0.86(0.70-0.99) <0.001
               (95%Cl)  1.0                                Frequency  T2DM(n=9 828)  0.79(0.94-1.09) <0.001
                                                                 High frequency
               OR                                      60 000    Never       Ref.
                                                                             0.90(0.77-1.05) 0.193
                                                                 Low frequency
                                                                 Moderate frequency  0.88(0.75-1.03) 0.112
                                       40 921(24.48%)
                              35 478(25.82%)  36 937(76.5%)  40 000  High frequency  0.83(0.70-0.99) 0.037
                                                                COPD(n=6 283)
                0.9
                                                                 Never       Ref.
                                                                 Low frequency  1.12(0.91-1.37) 0.299
                                                       20 000
                                               11 348(23.5%)     Moderate frequency  1.00(0.82-1.24) 0.963
                  7 129(73.05%)                                  High frequency  0.93(0.75-1.17) 0.558
                      2 630(26.95%)                             Stroke(n=3 936)
                0.8                                    0
                                                                 Never       Ref.
                                                                 Low frequency  0.97(0.77-1.21) 0.759
                      Never  Low frequency  Moderate frequency High frequency
                                                                 Moderate frequency  0.89(0.71-1.12) 0.334
                                 Cheese intake
                                                                 High frequency  0.85(0.67-1.08) 0.192
                 The number and HST proportion of each cheese intake group are  Death(n=3 197)
                                                                 Never       Ref.
              presented by a grouped bar plot. The OR and 95% CI from fully adjust⁃
                                                                 Low frequency  0.91(0.72-1.17) 0.478
              ed model are presented by a solid line and two broken lines. Left axis:
                                                                 Moderate frequency  0.90(0.71-1.15) 0.408
              OR(95%CI)of cheese intake related to HST. Right axis:frequency of  High frequency  1.04(0.80-1.35) 0.788
                                                                Cancer(n=2 430)
              each cheese intake group. Lateral axis:cheese intake group.
                                                                 Never       Ref.
               图2 奶酪摄入量和HST的限制立方样条图和分组柱状图                        Low frequency  0.87(0.66-1.14) 0.304
              Figure 2  Restricted cubic spline plot and grouped bar  Moderate frequency  0.83(0.63-1.08) 0.165
                       plot of cheese intake and HST             High frequency  0.87(0.65-1.17) 0.356
                                                                CHF(n=827)
                                                                 Never       Ref.
              MR 分析结果显示(图 4A),奶酪摄入可显著降低                          Low frequency  0.92(0.57-1.47) 0.721
              HST 风险(OR=0.83,95% CI:0.75~0.92)。此外,加              Moderate frequency  0.93(0.58-1.48) 0.749
                                                                 High frequency  0.99(0.59-1.66) 0.988
              权中位数法、简单中位数法和 MR⁃Egger 检验结果                                                 0.50  0.75  1.00  1.25  1.50  1.75
              相似,而 MR⁃Egger 检验表现出更宽的置信区间                                                          Odds ratio
             (OR=0.92,95% CI:0.52~1.61)。不过,没有发现水                    Ref:reference;MI:myocardial infarction;COPD:chronic obstructive
                                                                pulmonary disease;CHF:congestive heart failure.
              平多效性的证据(截距 P=0.713)。此外,Cochran’s
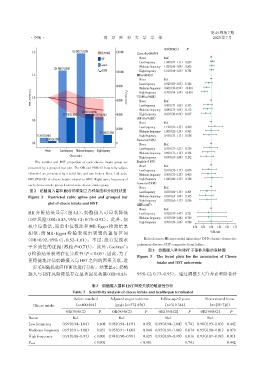
                                                                     图3 奶酪摄入量和HST子事件关联的森林图
              Q 检验结果表明存在异质性(P < 0.05),因此,为了
                                                                Figure 3  The forest plots for the association of Cheese
              更稳健地评估奶酪摄入与HST之间的因果关联,进                                    intake and HST sub⁃events
              一步采用随机效应IVW法进行分析。结果显示,奶酪
              摄入与HST风险降低存在显著因果关联(OR=0.83,                       95% CI:0.73~0.95)。通过调整3大营养素和膳食纤
                                           表3 奶酪摄入量和HST风险关联的敏感性分析
                                   Table 3  Sensitivity analysis of cheese intake and healthspan terminated

                                   Before matched   Adjusted major nutrients  Follow⁃up≥2 years  Never moved home
                Cheese intake      (n=400 894)        intake(n=372 856)     (n=319 344)          (n=270 720)
                               OR(95%CI)       P     OR(95%CI)      P     OR(95%CI)     P     OR(95%CI)    P
              Never                Ref.                 Ref.                 Ref.                Ref.
              Low frequency   0.99(0.94-1.04)  0.608 0.98(0.94-1.03)  0.051  0.99(0.94-1.04) 0.741 0.98(0.93-1.03) 0.442
              Moderate frequency 0.95(0.91-1.00)  0.051 0.95(0.91-1.00)  0.048  0.95(0.91-1.00) 0.074 0.95(0.90-1.01) 0.079
              High frequency  0.93(0.88-0.97) <0.001 0.94(0.90-0.99)  0.025  0.93(0.89-0.99) 0.016 0.93(0.87-0.98) 0.011
                                            <0.001               <0.001                0.741              0.442
              Ptrend

