


Page 99 - 南京医科大学自然版
P. 99
第45卷第7期          王 潇,王一帆,孙龙虎,等. 奶酪摄入与健康寿命终止风险的关联及其代谢机制研究[J].
                  2025年7月                     南京医科大学学报(自然科学版),2025,45(7):991-1000                       ·997 ·


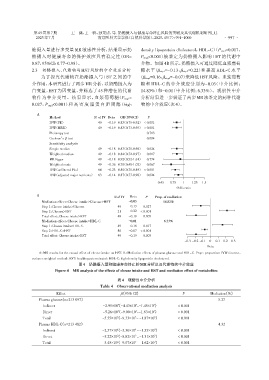
                维摄入量进行多变量 MR 敏感性分析,结果显示奶                          density lipoprotein cholesterol,HDL⁃C)(Pstep1=0.017,
                酪摄入对健康寿命的保护效应具有稳定性(OR=                            Pstep2<0.001)被鉴定为奶酪摄入影响 HST 的代谢中
                0.87,95%CI:0.77~0.98)。                            介物。如图4B所示,奶酪摄入可通过降低血浆葡萄
                2.3  奶酪摄入、代谢物与HST风险的中介效应分析                        糖水平(βstep1=-0.13,βstep2=0.22)和提高 HDL⁃C 水平
                    为了探究代谢物在奶酪摄入与 HST 之间的中                       (βstep1=0.16,βstep2=-0.07)来降低HST风险。血浆葡萄
                介作用,本研究进行了两步MR分析,以奶酪摄入为                           糖和 HDL⁃C 的中介效应分别为-0.03(中介比例:
                自变量,HST 为因变量,并筛选了 45 种潜在的代谢                       14.83%)和-0.01(中介比例:6.33%)。观察性中介

                物作为中介变量。结果显示,血浆葡萄糖(Pstep1=                        分析结果进一步验证了两步MR法鉴定的两种代谢
                0.027,Pstep2<0.001)和 高 密 度 脂 蛋 白 胆 固 醇(high       物的中介效应(表4)。

                  A
                        Method              N. of IV Beta  OR(95%CI)  P
                        IVW(FE)               49   -0.19 0.83(0.75⁃0.92) < 0.001
                        IVW(MRE)              49   -0.19 0.83(0.73⁃0.95) < 0.001
                        Pleiotropy test                              0.713
                        Cochran’s Q test                             0.004
                        Sensitivity analysis
                        Simple median         49   -0.18 0.83(0.71⁃0.98)  0.024
                        Weighted median       49   -0.18 0.84(0.72⁃0.97)  0.017
                        MR Egger              49   -0.18 0.92(0.52⁃1.61)  0.774
                        Weighted mode         49   -0.36 0.70(0.48⁃1.02)  0.067
                        IVW(unfiltered IVs)   64   -0.23 0.80(0.71⁃0.89) < 0.001
                        IVW(adjusted major nutrients)  63  -0.14 0.87(0.77⁃0.98)  0.024
                                                                          0.45  0.75  1  1.25  1.5
                                                                                   Odds ratio
                  B                                   N.of IV  Beta  P   Prop. of mediation
                    Mediation effect:Cheese intake>Glucose>HST  -0.03       14.82%
                    Step 1:Cheese intake>Glucose       49   -0.13  0.027
                    Step 2:Glucose>HST                 21    0.22  < 0.001
                    Total effect:Cheese intake>HST     49   -0.19  0.005
                    Mediation effect:Cheese intake>HDL⁃C    -0.01            6.33%
                    Step 1:Cheese intake>HDL⁃C         49    0.16  0.017
                    Step 2:HDL⁃C>HST                   80   -0.07  < 0.001
                    Total effect:Cheese intake>HST     49   -0.19  0.005
                                                                                      -0.3 -0.2 -0.1  0  0.1  0.2  0.3
                                                                                                 Beta
                   A:MR results for the causal effect of cheese intake on HST. B:Mediation effects of plasma glucose and HDL⁃C. Prop:proportion;IVW:inverse⁃
                variance weighted method;HST:healthspan terminated;HDL⁃C:high density lipoprotein cholesterol.
                                     图4 奶酪摄入量和健康寿命终止的MR分析以及代谢物的中介效应
                          Figure 4 MR analysis of the effects of cheese intake and HST and mediation effect of metabolites

                                                       表4   观察性中介分析
                                               Table 4 Observational mediation analysis
                           Effect                        β(95% CI)                   P            Mediation(%)
                   Plasma glucose(n=213 097)                                                          5.27
                                                       4
                                                                4
                                                                        4
                     Indirect                    -2.95×10(-4.43×10 -1.45×10)       < 0.001
                                                                -
                                                       3
                                                                3
                                                                        3
                     Direct                      -5.26×10(-9.00×10 -1.63×10)       < 0.001
                                                                -
                                                               3
                                                       3
                                                                        3
                     Total                      -5.55×10(-9.33×10 - -1.87×10)      < 0.001
                   Plasma HDL⁃C(n=213 482)                                                            4.32
                                                               4
                                                                        4
                                                       4
                     Indirect                   -2.37×10(-3.30×10 - -1.55×10)      < 0.001
                                                                -
                                                                        3
                                                       3
                                                               3
                     Direct                     -5.22×10(-8.82×10 - -1.31×10)      < 0.001
                                                                -
                                                       3
                                                               3
                                                                        3
                     Total                      -5.45×10(-9.07×10 - -1.62×10)      < 0.001
                                                                -

