


Page 99 - 《南京医科大学学报(自然科学版)》2025年第9期
P. 99
第45卷第9期 付紫琪,郦 丽,吴 琳,等. 尿/血清中性粒细胞明胶酶相关脂质运载蛋白比值与网织红细胞百分比的乘积在
                  2025年9月      鉴别急性肾损伤和慢性肾脏病中的价值[J]. 南京医科大学学报(自然科学版),2025,45(9):1307-1315·1311               ·


               (续表2)
                             Variable                      AKI(n= 46)              CKD(n= 46)              P
                  LDL⁃C[mmol/L,M(P25,P75 )]              2.82(1.99,3.61)          2.81(2.21,3.68)         0.803
                  BUN[mmol/L,M(P25,P75 )]               13.83(9.18,20.74)        15.77(9.96,22.15)        0.563
                  SCr[μmol/L,M(P25,P75 )]             229.50(141.50,481.33)    298.30(172.25,434.75)      0.696
                  UA[μmol/L,M(P25,P75 )]              438.35(365.23,579.50)    464.00(350.58,546.73)      0.994
                  eGFR[mL/(min·1.73 m),M(P25,P75 )]     23.19(9.76,42.59)        16.20(12.01,33.73)       0.722
                                   2
                  u/sNGAL[M(P25,P75 )]                   0.64(0.33,1.52)          0.31(0.13,0.76)         0.006
                  uPCR[g/g,M(P25,P75 )]                  2.54(0.66,3.95)          2.23(0.76,4.81)         0.997
                  u/sNGAL×Ret%[M(P25,P75 )]              1.27(0.59,3.31)          0.46(0.25,1.53)         0.001
                   For the abbreviations,please see those in the Table 1.

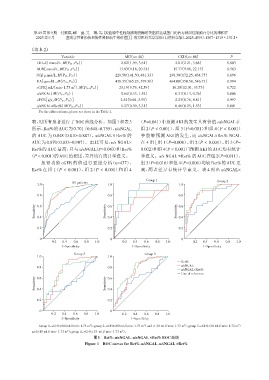
                物,对所有患者进行了ROC曲线分析。如图1和表3                         (P=0.041)中预测AKI的发生具有价值,u/sNGAL在
                所示,Ret%的AUC为0.701(0.648~0.755),u/sNGAL            组 2(P < 0.001)、组 3(P=0.001)和组 4(P < 0.001)
                的 AUC 为 0.848(0.810~0.887),u/sNGAL × Ret% 的       中能够预测 AKI 的发生,而 u/sNGAL×Ret% NGAL

                AUC 为 0.870(0.833~0.907)。由此可见,u/s NGAL×           在 4 组[组 1(P=0.008)、组 2(P < 0.001)、组 3(P=
                Ret%的 AUC 最高,且与 u/sNGAL(P=0.043)和 Ret%            0.002)和组4(P < 0.001)]预测AKI的AUC均有统计
               (P < 0.001)的AUC值相比,差异均有统计学意义。                      学意义。u/s NGAL ×Ret% 的AUC在组2(P=0.011)、
                    按肾功能 eGFR 的值进行亚组分析(n=437)。                    组 3(P=0.016)和组 4(P=0.006)均较 Ret%的 AUC 更
                Ret% 在 组 1(P < 0.001)、组 2(P < 0.001)和 组 4         高,两者差异有统计学意义。表 4 列出 u/sNGAL×


                                                                     Group 1                         Group 2
                                  All patients
                  1.0                              1.0                              1.0
                  0.8                              0.8                              0.8

                 Sensitivity  0.6                 Sensitivity  0.6                 Sensitivity  0.6

                  0.4
                                                                                    0.4
                                                   0.4
                  0.2                              0.2                              0.2

                   0                                0                                0
                         0.2  0.4  0.6  0.8  1.0          0.2  0.4  0.6  0.8  1.0         0.2  0.4  0.6  0.8  1.0
                             1-Specificity                    1-Specificity                    1-Specificity
                                   Group 3                          Group 3
                  1.0                              1.0
                                                                                    Ret%
                                                                                    u/sNGAL
                  0.8                              0.8
                                                                                    u/sNGAL×Ret%
                                                                                    Line of reference
                 Sensitivity  0.4                 Sensitivity  0.4
                                                   0.6
                  0.6


                  0.2                              0.2

                   0                                0
                         0.2  0.4  0.6  0.8  1.0         0.2  0.4   0.6  0.8  1.0
                             1-Specificity                   1-Specificity
                   Group 1,eGFR≥60 mL/(min·1.73 m );group 2,eGFR<60 mL/(min·1.73 m )and ≥ 30 mL/(min·1.73 m );group 3,eGFR<30 mL/(min·1.73 m )
                                                                                      2
                                           2
                                                                                                               2
                                                                   2
                and≥15 mL/(min·1.73 m );group 4,eGFR<15 mL/(min·1.73 m ).
                                                         2
                                2
                                            图1   Ret%、u/sNGAL、u/sNGAL ×Ret% ROC曲线
                                        Figure 1 ROC curves for Ret%,u/sNGAL,u/sNGAL ×Ret%

