


Page 113 - 南京医科大学自然版
P. 113
第46卷第4期          陈语悉,高 翔,许 洁,等. 移植肾病理指标对不同时期移植肾功能异常的预测价值[J].
                  2026年4月                      南京医科大学学报(自然科学版),2026,46(4):577-586                       ·581 ·


                                            表2 与活检时移植肾功能异常有关的多因素分析
                                 Table 2 Multivariate analysis associated with abnormal graft function at biopsy
                          Characteristic        Regression coefficient  S.E    Z        P         OR(95%CI)
                   HLA⁃I antibody MFI[M(P25,P75)]     0.00           0.00    -1.57     0.116    1.00(1.00-1.00)
                   i score[n(%)]
                     0                                                                               1.00
                     ≥1                               1.00           0.45    -2.21     0.027    2.73(1.12-6.63)
                   ptc score[n(%)]
                     0                                                                               1.00
                     ≥1                               0.86           0.45    -1.90     0.057    2.35(0.97-5.69)
                   OR:odds ratio;CI:confidence interval.


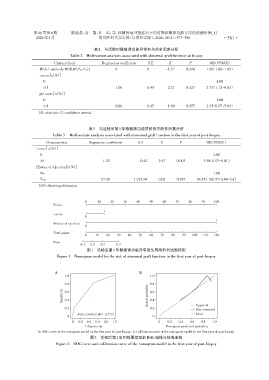
                                          表3 与活检后第1年移植肾功能异常有关的多因素分析
                         Table 3  Multivariate analysis associated with abnormal graft function in the first year of post⁃biopsy

                      Characteristic      Regression coefficient  S.E      Z        P           OR(95%CI)
                  i score[n(%)]
                    0                                                                              1.00
                    ≥1                          01.25          0 000.42   2.97     0.003       3.50(1.53-8.01)
                  History of rejection[n(%)]
                    No                                                                             1.00
                    Yes                         17.40          1 032.04   0.02     0.987    36 151 160.57(0.00-Inf)
                   DGF:delayed graft function.


                                        0     10    20    30    40    50    60    70    80    90    100
                          Points
                                                 1
                          i score
                                        0
                                                                                                    1
                          History of rejection
                                        0
                          Total points
                                        0    10   20   30   40   50   60   70   80   90   100  110  120
                          Risk
                                      0.3  0.5  0.7    0.9
                                         图1 活检后第1年移植肾功能异常发生风险的列线图模型
                           Figure 1 Nomogram model for the risk of abnormal graft function in the first year of post⁃biopsy


                          A                                      B
                               1.0                                    1.0

                               0.8                                    0.8
                              Sensitivity  0.6                       Actual probaility  0.6

                                                                      0.4
                               0.4
                               0.2                                    0.2                  Apparent
                                                                                           Bias⁃corrected
                                     AUC:0.690(0.607-0.773)                                Ideal
                                0                                      0
                                  .0  0.2  0.4  0.6  0.8  1.0             .0  0.2   0.4  0.6  0.8  1.0
                                        1-Speciticity                        Nomogram predicted probaility
                  A:ROC curve of the nomogram model in the first year of post⁃biopsy. B:Calibration curve of the nomogram model in the first year of post⁃biopsy.
                                           图2  活检后第1年列线图模型的ROC曲线与校准曲线
                           Figure 2 ROC curve and calibration curve of the nomogram model in the first year of post⁃biopsy

