


Page 114 - 南京医科大学自然版
P. 114
第46卷第4期
               ·582 ·                            南 京    医 科 大 学 学         报                        2026年4月


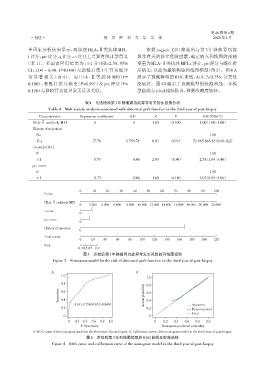
              单因素分析结果显示,两组在 HLA⁃Ⅱ类抗体 MFI、                            依据 Logistic 回归筛选出与第 3 年移植肾功能
              i 评分,ptc评分,g评分,ci评分上差异有统计学意义                      异常有关的独立危险因素,确定纳入列线图的预测
             (表 1)。多因素回归结果为 i ≥1 分(OR=2.58,95%                  变量为HLA⁃Ⅱ类抗体MFI、i评分、ptc评分与既往排
              CI:1.04 ~ 6.40,P=0.040)与活检后第 3 年肾功能异              斥病史,以此为基础构建列线图模型(图3)。图4 A
              常显著相关(表 4)。而 HLA⁃Ⅱ类抗体 MFI(P=                      展示了预测模型的ROC曲线,AUC为0.756,分类性
              0.100)、有既往排斥病史(P=0.991)及 ptc 评分(P=                能较好。图 4B 展示了预测模型的校准曲线。本模
              0.110)与移植肾功能异常无显著关联。                              型曲线与Ideal线较贴合,预测准确度较好。


                                        表4 与活检后第3年移植肾功能异常有关的多因素分析
                       Table 4 Multivariate analysis associated with abnormal graft function in the third year of post⁃biopsy
                   Characteristic     Regression coefficient  S.E       Z         P            OR(95%CI)
                HLA⁃Ⅱ antibody MFI          00.00             0.00     1.65     0.100        1.00(1.00-1.00)
                History of rejection
                  No                                                                              1.00
                  Yes                       17.78          1 559.74    0.01     0.991     52 865 863.83(0.00-Inf)
                i score[n(%)]
                  0                                                                               1.00
                  ≥1                        00.95             0.46     2.05     0.040        2.58(1.04-6.40)
                ptc score
                  0                                                                               1.00
                  ≥1                        00.73             0.46     1.60     0.110        2.07(0.85-5.06)


                                      0     10    20    30    40     50    60    70     80    90    100
                      Points
                      HLA⁃Ⅱ antibody MFI
                                      0   2 000  4 000  6 000  8 000 10 000 12 000 14 000 16 000 18 000 20 000 22 000
                                           1
                      i score
                                      0
                                          1
                      ptc score
                                      0
                                                                                      1
                      History of rejection
                                      0
                      Total points
                                      0    20    40    60   80    100  120   140   160  180   200   220
                      Risk
                                     0.30.50.7 0.9
                                       图3 活检后第3年移植肾功能异常发生风险的列线图模型
                         Figure 3 Nomogram model for the risk of abnormal graft function in the third year of post⁃biopsy

                         A                                      B
                             1.0
                                                                     1.0
                             0.8                                     0.8
                            Sensitivity  0.6                       Actual probaility  0.6

                             0.4
                                   AUC:0.756(0.672-0.840)            0.4                  Apparent
                             0.2                                     0.2                  Bias⁃corrected
                                                                                          Ideal
                              0                                       0
                                .0  0.2  0.4  0.6  0.8  1.0             .0  0.2  0.4  0.6  0.8  1.0
                                      1-Speciticity                         Nomogram predicted probaility
                A:ROC curve of the nomogram model in the third year of post⁃biopsy. B:Calibration curve of the nomogram model in the third year of post⁃biopsy.
                                         图4   活检后第3年列线图模型的ROC曲线及校准曲线
                         Figure 4  ROC curve and calibration curve of the nomogram model in the third year of post⁃biopsy

