
Page 10 - 南京医科大学自然版
P. 10
第46卷第5期
·632 · 南 京 医 科 大 学 学 报 2026年5月
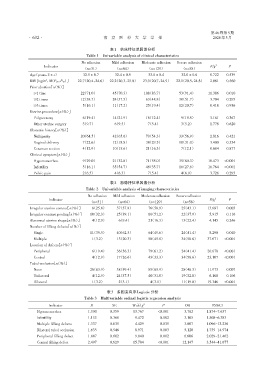
表1 临床特征单因素分析
Table 1 Univariable analysis of clinical characteristics
No adhesion Mild adhesion Moderate adhesion Severe adhesion
Indicator F/χ 2 P
(n=31) (n=64) (n=129) (n=58)
Age(years,x ± s) 32.5 ± 0.7 32.4 ± 0.5 33.0 ± 0.4 32.0 ± 0.6 0.722 0.539
BMI[kg/m ,M(P25,P75)] 22.7(20.4,24.6) 22.2(20.3,25.0) 23.0(20.7,24.9) 22.1(20.5,24.8) 2.061 0.560
2
Prior abortion[n(%)]
≥1 time 22(71.0)000 45(70.3)000 108(83.7)0000 53(91.4)000 11.386 0.010
≥2 times 12(38.7)000 24(37.5)000 63(48.8)000 30(51.7)000 3.704 0.295
≥3 times 5(16.1)00 11(17.2)000 25(19.4)000 12(20.7)000 0.418 0.936
Uterine procedure[n(%)]
Polypectomy 6(19.4)00 14(21.9)000 16(12.4)000 9(15.5)00 3.161 0.367
Other uterine surgery 3(9.7)000 6(9.5)000 7(5.4)000 3(5.2)000 1.778 0.620
Obstetric history[n(%)]
Nulliparity 20(64.5)000 42(65.6)000 70(54.3)000 33(56.9)000 2.816 0.421
Vaginal delivery 7(22.6)00 12(18.8)000 38(29.5)000 18(31.0)000 3.400 0.334
Cesarean section 4(12.9)00 10(15.6)000 21(16.3)000 7(12.1)00 0.684 0.877
Clinical symptom[n(%)]
Hypomenorrhea 9(29.0)00 21(32.8)000 71(55.0)000 35(60.3)000 16.473 <0.001
Infertility 5(16.1)00 35(54.7)000 46(35.7)000 16(27.6)000 16.764 <0.001
Pelvic pain 2(6.5)000 4(6.3)000 7(5.4)000 4(6.9)000 3.726 0.293
表2 影像特征单因素分析
Table 2 Univariable analysis of imaging characteristics
No adhesion Mild adhesion Moderate adhesion Severe adhesion
Indicator F/χ 2 P
(n=31) (n=64) (n=129) (n=58)
Irregular uterine contour[n(%)] 08(25.8) 37(57.8) 76(58.9) 25(43.1) 13.687 0.003
Irregular contrast pooling[n(%)] 10(32.3) 25(39.1) 66(51.2) 22(37.9) 5.915 0.116
Abnormal uterine shape[n(%)] 04(12.9) 6(9.4) 21(16.3) 13(22.4) 4.145 0.246
Number of filling defects[n(%)]
Single 11(35.5) 40(62.5) 64(49.6) 24(41.4) 8.290 0.040
Multiple 1(3.2) 13(20.3) 58(45.0) 34(58.6) 37.671 <0.001
Location of defects[n(%)]
Peripheral 06(19.4) 36(56.3) 79(61.2) 24(41.4) 20.678 <0.001
Central 04(12.9) 17(26.6) 43(33.3) 34(58.6) 23.107 <0.001
Tubal occlusion[n(%)]
None 26(83.9) 38(59.4) 85(65.9) 28(48.3) 11.973 0.007
Unilateral 04(12.9) 24(37.5) 40(31.0) 19(32.8) 6.108 0.106
Bilateral 1(3.2) 2(3.1) 4(3.1) 11(19.0) 19.346 <0.001
表3 多因素有序Logistic分析
Table 3 Multivariable ordinal logistic regression analysis
Indicator B SE Wald χ 2 P OR 95%CI
Hypomenorrhea 1.330 0.359 13.767 <0.001 3.782 1.874-7.637
Infertility 1.133 0.368 09.472 0.002 3.105 1.508-6.383
Multiple filling defects 1.337 0.635 04.429 0.035 3.807 1.096-13.236
Bilateral tubal occlusion 1.635 0.546 08.971 0.003 5.128 1.759-14.974
Peripheral filling defect 1.887 0.602 09.840 0.002 6.606 2.029-21.462
Central filling defect 2.497 0.629 15.784 <0.001 12.147 3.544-41.677