


Page 12 - 南京医科大学自然版
P. 12
第46卷第8期
               ·1118 ·                           南 京    医 科 大 学 学         报                        2026年8月


              A                                                   B
                       Patient IDs
                       Pt 5         20.5 m                               40                                +14.51% *  +22.99%  +28.21%
                    Group 1  Pt 11  16.5 m   Regimen(Bar color)          20  RP threshold                +8.33%
                                   18.0 m
                                              TACE+Target+immuno+
                       Pt 8
                      Pt 20         21.0 m    radiotherapy             (%)  0
                                              TACE+Target+immuno
                      Pt 14        18.0 m    Therapy status          Best change in target lesion size  from baseline  -20  -18.64%  -18.43%  -14.47%  -5.82%  #
                                    21.0 m
                 Clinical response before progression  Group 2  Pt 19  15.0 m 24.0 m  Solid color=Original regimen  -60  -60.76%  11  Pt  -57.33%  4  Pt  -56.32%  8  Pt  -53.85%  14  Pt  -42.68%  5  Pt  -38.75%  9  Pt  -37.59%  20  Pt  -37.59%  19  Pt  -35.56%  16  Pt  -33.85%  12  Pt  -30.77%  15  Pt  -26.80%  6  Pt  18  Pt  1  Pt  13  Pt  RP threshold 17  Pt
                                              Target+immuno only
                      Pt 15
                      Pt 12
                                    21.0 m
                                                                        -40
                       Pt 9
                                 15.0 m
                                              =Switched to 2nd⁃line
                                   18.5 m
                       Pt 4
                                             Events
                                   19.0 m
                      Pt 16
                                                                                                      #
                                                                        -80
                                              First PR
                                                                                                            3
                                                                                                       2
                                                                                                           10
                                                                                                         7
                       Pt 1
                                                                                                            Pt
                                                                                                         Pt
                                                                                                       Pt
                                              Conversion surgery
                                                                                                           Pt
                                   18.0 m
                       Pt 6
                    Group 3
                      Pt 18
                                              Ongoing
                                    21.0 m
                       Pt 7
                      Pt 13      15.0 m  27.0 m  Progression/recurrence  Group 1          Patient IDs Group 3  #
                       Pt 2      15.0 m                                Group 2                  Group 4
                                                                       Targeted therapy+immunotherapy  Received radiotherapy
                       Pt 3      15.0 m
                      Pt 10        18.0 m
                    Group 4  Pt 17  0  3  6  9  12  15  18  21  24  ➝ 30
                                       27
                          Time from treatment
                           initiation(months)
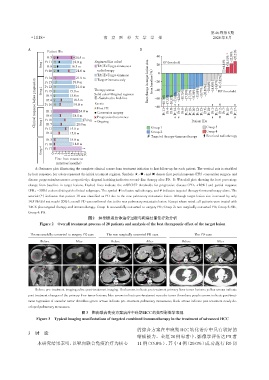
                 A:Swimmer plot:illustrating the complete clinical course from treatment initiation to last follow⁃up for each patient. The vertical axis is stratified
              by best response;bar colors represent the initial treatment regimen. Symbols ★,●,and ✖ denote first partial response(PR),conversion surgery,and
              disease progression/recurrence,respectively;diagonal hatching indicates second⁃line therapy after PD. B:Waterfall plot:showing the best percentage
              change from baseline in target lesions. Dashed lines indicate the mRECIST thresholds for progressive disease(PD,+20% )and partial response
             (PR,-30%);colors distinguish clinical subgroups. The symbol  indicates radiotherapy,and # indicates targeted therapy+immunotherapy alone. The
              asterisk(*)indicates that patient 10 was classified as PD due to the new pulmonary metastatic lesion. Although target lesion size increased by only
              14.51%(did not reach+20%),overall PD was confirmed due to the new pulmonary metastatic lesion. Except where noted,all patients were treated with
              TACE plus targeted therapy and immunotherapy. Group 1:successfully converted⁃to⁃surgery PR;Group 2:non⁃surgically converted PR;Group 3:SD;
              Group 4:PD.
                                          图2 20例患者总体治疗过程与靶病灶最佳疗效分析
                   Figure 2 Overall treatment process of 20 patients and analysis of the best therapeutic effect of the target lesion
               The successfully converted⁃to⁃surgery PR case  The non⁃surgically converted PR case  The PD case
                    Before          After           Before           After           Before          After

                 Before:pre⁃treatment imaging;after:post⁃treatment imaging. Red arrows indicate pre treatment primary liver tumor lesions;yellow arrows indicate
              post treatment changes of the primary liver tumor lesions;blue arrows indicate pre⁃treatment vascular tumor thrombus;purple arrows indicate post treat⁃
              ment regression of vascular tumor thrombus;green arrows indicate pre⁃treatment pulmonary metastases;black arrows indicate post treatment newly de⁃
              veloped pulmonary metastases.
                                       图3  靶向联合免疫方案治疗中晚期HCC的典型影像学表现
                  Figure 3  Typical imaging manifestations of targeted combined immunotherapy in the treatment of advanced HCC

                                                                的综合方案在中晚期 HCC 转化治疗中具有较好的
              3  讨 论
                                                                缩瘤能力。全组 20 例患者中,影像学评估达 PR 者
                  本研究结果表明,以靶向联合免疫治疗为核心                          11 例(55.0%),其中 4 例(20.0%)成功施行 R0 切

