


Page 22 - 南京医科大学自然版
P. 22
第46卷第8期
               ·1128 ·                           南 京    医 科 大 学 学         报                        2026年8月


                               LR                            Iinear_SVM                         NB
                 1.0                             1.0                             1.0

                                                 0.8
                 0.8
                                                                                 0.8
                True positive rate  0.6         True positive rate  0.6          True positive rate  0.6
                                                 0.4
                 0.4
                                                                                 0.4
                 0.2            Train(area=0.651)  0.2          Train(area=0.642)  0.2           Train(area=0.668)
                                Val(area=0.667)                 Val(area=0.653)                  Val(area=0.673)
                  0                               0                                0
                   .0  0.2  0.4  0.6  0.8   1.0    .0   0.2  0.4  0.6  0.8  1.0     .0  0.2  0.4  0.6  0.8  1.0
                          False positive rate              False positive rate             False positive rate
                              MLP                              GBM                            LightGBM
                 1.0                             1.0                             1.0

                                                                                 0.8
                                                 0.8
                 0.8
                True positive rate  0.6         True positive rate  0.6          True positive rate  0.6
                                                 0.4
                 0.4
                                                                                 0.4
                 0.2            Train(area=0.870)  0.2          Train(area=0.961)  0.2           Train(area=0.649)
                                Val(area=0.407)                 Val(area=0.537)                  Val(area=0.637)
                  0                               0                                0
                   .0  0.2  0.4  0.6  0.8   1.0    .0   0.2  0.4  0.6  0.8  1.0     .0  0.2  0.4  0.6  0.8  1.0
                          False positive rate              False positive rate             False positive rate
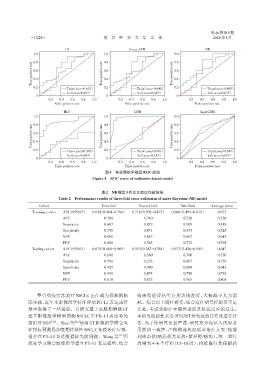
                                                  图4  各影像组学模型ROC曲线
                                            Figure 4 ROC curve of radiomics⁃based model


                                                表2 NB模型3折交叉验证性能结果
                            Table 2 Performance results of three⁃fold cross⁃validation of naive Bayesian(NB)model

                   Cohort                       First fold       Second fold        Third fold    Average value
                Training cohort  AUC(95%CI)  0.638(0.484-0.784)  0.718(0.502-0.875)  0.668(0.499-0.811)  0.675
                              ACC                0.700             0.740              0.720          0.720
                              Sensiticity        0.667             0.879              0.909          0.818
                              Specificity        0.750             0.471              0.353          0.525
                              NPV                0.600             0.667              0.667          0.645
                              PPV                0.800             0.763              0.732          0.765
                Testing cohort  AUC(95%CI)  0.675(0.468-0.909)  0.593(0.283-0.788)  0.673(0.426-0.901)  0.647
                              ACC                0.840             0.560              0.760          0.720
                              Sensiticity        0.990             0.333              0.867          0.730
                              Specificity        0.429             0.900              0.600          0.643
                              NPV                0.990             0.474              0.750          0.738
                              PPV                0.818             0.833              0.765          0.805


                  整合免疫疗法治疗 NSCLC 正在成为标准的临                       临床特征评估生存期表现良好,大幅减少人力消
              床实践,近年来影像组学特征评估 PD⁃L1 表达或疗                        耗。综合以上既往研究,结合过往研究经验及不足

              效中取得了一些进展。有研究基于动脉期增强 CT                           之处,考虑到治疗中假性进展及延迟反应的发生,
              建立影像组学模型预测 NSCLC 中 PD⁃L1 表达和免                     本研究创新性采用iRECIST对免疫治疗疗效进行评
              疫治疗预后     [10] 。Shao 等 [12] 使用 CT 影像组学联合炎         估,为了使研究更加严谨,研究充分保证入组患者
              症指标预测局部晚期转移性NSCLC免疫治疗疗效,                          用药的一致性,严格筛选免疫联合治疗方案(帕博
              但存在 PD⁃L1 表达数据缺失的问题。Wang 等               [17] 用   利珠单抗/纳武利尤单抗+紫杉醇/顺铂),统一治疗
              深度学习联合影像组学建立 PD⁃L1 表达模型,结合                        周期为 4~6 个疗程(12~18 周),排除既往免疫耐药

