


Page 57 - 南京医科大学自然版
P. 57
第46卷第9期          王佳月,王艳丽,王正霞,等. 脉冲振荡技术参数联合模型在老年慢性阻塞性肺疾病中的
                  2026年9月             诊断价值分析[J]. 南京医科大学学报(自然科学版),2026,46(9):1323-1330                   ·1327 ·


                              Healthy control group                      表3 IOS与肺通气功能指标的相关性分析
                                                 ***
                      100%    COPD group
                                                  91.3            Table 3  Correlation analysis between IOS parameters
                                                                           and pulmonary ventilation function indicators
                       80%                     74.3
                              ***                                                                          (r)
                               59.7                                Parameter FEV1%pred FEV1/FVC MMEF%pred RV/TLC
                       60%
                                                                   R5        -0.500 *  -0.445 *  -0.504 *  -0.332 *
                                    ***
                       40%                                         R20       -0.226 *  -0.184 *  -0.231 *  -0.171 *
                                           **
                                     28.7                                         *         *         *        *
                            21.8                                   R5~R20    -0.584   -0.529     -0.588   -0.383
                       20%                 17.3                                   *         *         *        *
                                  12.9                             Fres      -0.546   -0.504     -0.540   -0.358
                                         5.9
                                                                   X5        -0.609 *  -0.541 *  -0.614 *  -0.409 *
                         0                                                        *         *         *        *
                              R5    R10   R20    X5                X20       -0.529   -0.487     -0.524   -0.339
                   Intergroup comparisons were performed using the χ test. P < 0.01,  Spearman rank correlation analysis was used. All correlation coeffi⁃
                                                   2
                                                       **
                ***                                                                      *
                 P < 0.001.                                       cients were statistically significant. P < 0.001. FEV1%pred:forced expi⁃
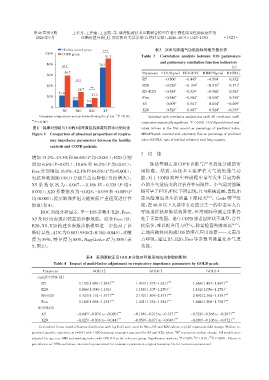
                图1 健康对照组与COPD组呼吸阻抗参数的异常比例对比                       ratory volume in the first second as percentage of predicted value;
                Figure 1  Comparison of abnormal proportions of respira⁃  MMEF%pred:maximal mid⁃expiratory flow as percentage of predicted
                        tory impedance parameters between the healthy  value;RV/TLC:ratio of residual volume to total lung capacity.
                        controls and COPD patients
                                                                  3  讨 论
                增加 15.2%、49.3%和 66.6%(P 均<0.001);R20 分别
                增加 6.6%(P=0.051)、18.6%和 16.2%(P 均<0.01);              肺活量测定是COPD诊断与严重程度分级的常
                Fres 分别增加 16.0%、42.1%和 64.6%(P 均<0.001)。          用标准。然而,该技术主要评估大气道的通气功
                电抗参数则随 GOLD 分级升高而降低(负值增大):                        能,对于 COPD 病理生理进程中最早发生且最为核
                X5 系 数 依 次 为 - 0.047、- 0.186 和 - 0.328(P 均 <      心的小气道病变的评估存在局限性。小气道功能障
                0.001);X20 系数依次为-0.025、-0.059 和-0.089(P           碍可早于FEV1/FVC下降出现,且与疾病进展、急性加
                均<0.001),提示肺弹性阻力随疾病严重程度进行性                        重风险增加及生活质量下降相关                [11] 。Cosío 等 [12] 发
                加重(表4)。                                           现,在40岁以上人群中有近四分之一的中老年人有
                    ROC曲线分析显示,单一IOS参数中X20、Fres、                   呼吸道症状和肺结构异常,但常规肺量测定结果仍
                X5及R5均表现出较高的诊断效能。联合Fres、R5、                       处于正常范围。老年COPD患者因症状不典型、合并
                R20、X5、X20构建多参数诊断模型进一步提高了诊                        疾病多、难以配合用力呼气,肺量检查失败率高                     [4,13] 。
                断特异性,AUC为0.803(95%CI:0.761~0.845),灵敏              上述问题共同构成IOS的潜在应用场景——无需用
                度为 59%,特异度为 88%,Nagelkerke R 为 38%(表              力呼吸,通过 R5、R20、Fres 等参数直接量化小气道
                                                   2
                5,图2)。                                            功能。


                                         表4 多因素校正后GOLD分级对呼吸系统阻抗参数的影响
                          Table 4 Impact of multi⁃factor adjustment on respiratory impedance parameters by GOLD grade

                     Parameter              GOLD 2                    GOLD 3                    GOLD 4
                  exp(β)(95% CI)
                                                    ***
                    R5                1.152(1.067-1.243) 00    -1.493(1.375-1.621) ***   -1.666(1.487-1.867) ***
                    R20               1.066(1.000-1.136)0000   -1.186(1.107-1.270) ***   -1.162(1.056-1.278) **
                                                    ***
                    R5⁃R20            1.343(1.174-1.537) 00    -2.192(1.896-2.533) ***   -2.892(2.364-3.538) ***
                                                    ***
                    Fres              1.160(1.094-1.231) 00    -1.421(1.334-1.514) ***   -1.646(1.508-1.798) ***
                  B(95%CI)
                                                        ***
                    X5               -0.047(-0.074 to -0.020)  -0.186(-0.215 to -0.157) ***  -0.328(-0.368 to -0.287) ***
                                                        ***
                    X20              -0.025(-0.036 to -0.014)  -0.059(-0.071 to -0.046) ***  -0.089(-0.106 to -0.072) ***
                   Generalized linear models(Gamma distribution with log link)were used for Fres,R5 and R20,where exp(β)represents fold change. Median re⁃
                gression(quantile regression at τ=0.5)with 1 000 bootstrap resamples was used for X5 and X20,where“B”represents median change. All models were
                                                                                    *
                                                                                                  ***
                                                                                          **
                adjusted for age,sex,BMI and smoking index,with GOLD 1 as the reference group. Significance markers:P < 0.05,P < 0.01, P < 0.001. Values in
                parentheses are 95% confidence intervals(exponentiated for resistance parameters;original bootstrap CIs for reactance parameters).

