Page 40 - 南京医科大学自然版
P. 40

第44卷第4期
               ·478 ·                            南 京    医 科 大 学 学         报                        2024年4月


                               A                *                  B              ***
                                           ***                                   **
                                    0.3                                0.3
                                   nm)  0.2                           nm)  0.2
                                   (490  D  0.1                       (490  D  0.1


                                     0                                  0
                                         0  0.1 1.0 10.0 100.0              0  0.1  1.0 10.0 100.0
                                           TCDCA(μmol/L)                    LPS+TCDCA(μmol/L)
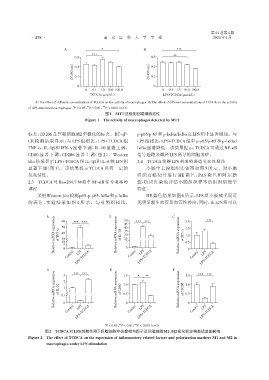
                 A:The effect of different concentrations of TCDCA on the activity of macrophages. B:The effect of different concentrations of TCDCA on the activity
                                   *
                                         **
                                                ***
              of LPS⁃stimulated macrophages. P < 0.05,P < 0.01, P < 0.001(n=3).
                                                  图1  MTT法检测巨噬细胞活性
                                        Figure 1  The activity of macrophages detected by MTT
              标志,CD206是巨噬细胞M2型极化的标志。RT⁃qP⁃                      p⁃p65/p⁃65和p⁃IκBα/IκBα在LPS组中显著增加。与
              CR 检测结果显示,与 LPS 组相比,LPS+TCDCA 组                   LPS组相比,LPS+TCDCA组中p⁃p65/p⁃65和p⁃IκBα/
              TNF⁃α、IL⁃1β和 IFN⁃γ显著下调,IL⁃10 显著上调,                IκBα显著降低。该结果提示,TCDCA可通过NF⁃κB
              CD80 显著下调,CD206 显著上调(图 2)。Western                 信号通路来减轻LPS诱导的细胞炎症。
              blot 结果显示 LPS+TCDCA 组 IL⁃1β和 IL⁃6 较 LPS 组         2.4  TCDCA缓解LPS刺激的肠道炎症性损伤
              显著下调(图 3)。该结果提示 TCDCA 具有一定的                            小肠中上段组织实体图如图 5 所示。对小肠
              抗炎活性。                                             组织石蜡切片进行 HE 染色、PAS 染色和阿尔新
              2.3  TCDCA对Raw264.7细胞中NF⁃κB信号通路的                  蓝⁃核固红染色评估小肠组织样本的组织病理学
              调控                                                特征。
                  采用Western blot检测p65、p⁃p65、IκBα和p⁃IκBα              HE 染色结果如图 6 所示,LPS 组小肠绒毛间可
              的表达,实验结果如图 4 所示。与对照组相比,                           见明显新生血管及血管性渗出,同时,在LPS组可以


                      A      60    *** ***         B      50    *** ***          C     2.0      ***
                          Relative mRNA expression  of TNF⁃α 50  Relative mRNA expression  IL⁃1β  of  40 5  Relative mRNA expression  of IFN⁃γ  1.5
                                                          45
                                                          35
                             40
                                                          30
                                                                                       1.0
                                                          25
                             30
                             10
                                                                                       0.5
                              5
                              0
                                                                  LPS
                                     LPS
                                Control  LPS+TCDCA         0 Control  LPS+TCDCA         0 Control  LPS+TCDCA
                                                                                              LPS
                      D       3    *** ***          E     1.5    *  **           F     1.5  *** ***
                          Relative mRNA expression  of IL⁃10  0.1 2 1  Relative mRNA expression  of CD80  1.0  Relative mRNA expression  of CD206  1.0

                                                                                       0.5
                                                          0.5
                              0
                                                                                              LPS
                                                                  LPS
                                     LPS
                                Control  LPS+TCDCA         0 Control  LPS+TCDCA         0 Control  LPS+TCDCA
                                                 *      **     ***
                                                  P < 0.05,P < 0.01, P < 0.001(n=3).
                      图2  TCDCA对LPS刺激作用下巨噬细胞中炎症相关因子及巨噬细胞M1、M2极化标志物表达量的影响
              Figure 2  The effect of TCDCA on the expression of inflammatory related factors and polarization markers M1 and M2 in
                      macrophages under LPS stimulation
   35   36   37   38   39   40   41   42   43   44   45