Page 41 - 南京医科大学自然版
P. 41

第44卷第6期           刘嘉浩,钱海声,高 欣,等. 基于生物信息学分析干性相关基因TCEAL7作为胃癌预后
                  2024年6月              标志物的研究[J]. 南京医科大学学报(自然科学版),2024,44(6):769-780                    ·777 ·
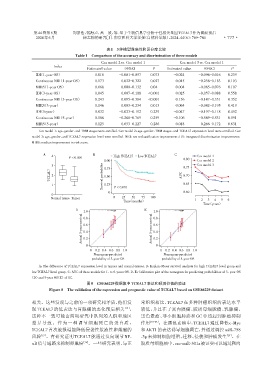

                                                  表1 3种模型准确性和区分度比较
                                    Table 1 Comparison of the accuracy and discrimination of three models

                                                Cox model 2 vs. Cox model 1         Cox model 3 vs. Cox model 1
                          Index
                                         Estimated value   95%CI        P     Estimated value  95%CI        P
                  IDI(1⁃year OS)             0.018      -0.001-0.057   0.073     -0.024      -0.096-0.016  0.239
                  Continuous NRI(1⁃year OS)  0.173       0.022-0.322   0.027     -0.015      -0.256-0.183  0.103
                  MIRS(1⁃year OS)            0.068       0.000-0.132   0.040     -0.004      -0.085-0.076  0.107
                  IDI(3⁃year OS)             0.045       0.007-0.108  <0.001     -0.025      -0.057-0.088  0.558
                  Continuous NRI(3⁃year OS)  0.243       0.095-0.384  <0.001     -0.156      -0.147-0.331  0.352
                  MIRS(3⁃year)               0.146       0.003-0.234   0.013     -0.064      -0.042-0.195  0.419
                  IDI(5⁃year)                0.032      -0.023-0.192   0.239     -0.047      -0.197-0.118  0.452
                  Continuous NRI(5⁃year)     0.186      -0.268-0.769   0.259     -0.106      -0.589-0.531  0.591
                  MIRS(5⁃year)               0.125      -0.053-0.227   0.286     -0.018      -0.266-0.172  0.631
                   Cox model 1:age,gender,and TNM stages were enrolled. Cox model 2:age,gender,TNM stages,and TCEAL7 expression level were enrolled. Cox
                model 3:age,gender,and TCEAL7 expression level were enrolled. NRI:net reclassification improvement;IDI:integrated discrimination improvement;
                MIRS:median improvement in risk score.

                     A                      B                                     C
                         4                           High TCEAL7  Low TCEAL7                Cox model 1
                                 P < 0.001                                            0.80
                                                 1.00                                       Cox model 2
                         3                       0.75                                 0.75  Cox model 3
                        TCEAL7  2               Survival probability  0.50           AUC  0.70


                         1                       0.25  P < 0.001                      0.65
                                                   0                                  0.60
                         0
                        Normal tissne Tumor          0   25   50  75  100
                                                          Time(months)                     1  2  3  4  5  6
                                                                                               Time(years)
                                    D   1.0                         E   1.0
                                       3⁃year survival  0.8            5⁃year survival  0.8
                                        0.6
                                                                        0.6

                                       Actual  0.4                     Actual  0.4
                                                                        0.2
                                        0.2
                                         0                               0
                                           0 0.2 0.4 0.6 0.8 1.0           0 0.2 0.4 0.6 0.8 1.0
                                            Nomogram⁃predicted               Nomogram⁃predicted
                                           probability of 3⁃year OS         probability of 5⁃year OS
                   A:The difference of TCEAL7 expression level in tumors and normal tissues. B:Kaplan⁃Meier survival analysis for high TCEAL7 level group and
                low TCEAL7 level group. C:AUC of three models for 1⁃ to 6⁃years OS. D,E:Calibration plot of the nomogram for predicting probabilities of 3⁃ year OS
               (D)and 5⁃year OS(E)of GC.
                                         图8   GSE66229数据集中TCEAL7表达和预测价值的验证
                        Figure 8  The validation of the expression and prognostic value of TCEAL7 based on GSE66229 dataset

                相关。这些发现与之前的一项研究相矛盾,他们发                            常组织相比,TCEAL7 在多种肿瘤组织的表达水平
                现 TCEAL7 的低表达与胃腺癌的恶化预后相关                  [19] 。  较低,并且在子宫内膜癌、胶质母细胞瘤、乳腺癌、
                这种不一致可能由两项研究中队列的人群和地区                             黑色素瘤、非小细胞肺癌和 GC 中均起到肿瘤抑制
                差异导致。作为一种调节细胞死亡的蛋白质,                              作用  [18-24] 。在黑色素瘤中,TCEAL7 通过降低 c⁃Myc
                TCEAL7首次被报道能降低侵袭性浆液性卵巢癌的                          和AKT1的表达诱导细胞凋亡,并通过调控miR⁃758
                风险  [15] 。有研究证明 TCEAL7 能通过负向调节 NF⁃                ⁃3p来抑制细胞增殖、迁移、侵袭和肿瘤发生                  [23] 。在
                κB信号通路来抑制卵巢癌           [16] 。一些研究表明,与正            胶质母细胞瘤中,exo⁃miR⁃301a被证实可以通过靶向
   36   37   38   39   40   41   42   43   44   45   46