Page 30 - 南京医科大学自然版
P. 30

第44卷第7期
               ·914 ·                          南   京 医 科       大 学      学 报                        2024年7月


                   A                                              B
                      0.9
                                                                      0.9
                      1⁃year OS rate  0.7                            1⁃year OS rate  0.7
                      0.8
                                                                      0.8
                      0.6
                                                                      0.6
                      Actual  0.5                                    Actual  0.5
                      0.4
                                                                      0.4
                      0.3
                                                                      0.3
                      0.2                                             0.2
                          0.3  0.4  0.5  0.6  0.7  0.8                       0.4   0.5  0.6   0.7   0.8
                                 Nomogram⁃predicted                             Nomogram⁃predicted
                                probability of 5⁃year OS                       probability of 5⁃year OS
                   C                                              D
                                                                      0.7
                      0.6                                             0.6
                      3⁃year OS rate  0.4                            3⁃year OS rate  0.5
                      0.5
                                                                      0.4
                      0.3
                                                                      0.3
                      Actual  0.2                                    Actual  0.2
                      0.1
                                                                      0.1
                        0                                               0
                             0.1  0.2  0.3  0.4  0.5                       0.1   0.2  0.3   0.4  0.5
                                 Nomogram⁃predicted                             Nomogram⁃predicted
                                probability of 5⁃year OS                       probability of 5⁃year OS
                   E                                              F
                                                                      0.6
                      5⁃year OS rate 0.5                             5⁃year OS rate  0.5
                      0.4
                                                                      0.4

                      Actual  0.3                                    Actual  0.3
                      0.2
                                                                      0.2
                         .0    0.1   0.2   0.3   0.4                          0.1  0.2  0.3  0.4  0.5
                                 Nomogram⁃predicted                             Nomogram⁃predicted
                                probability of 5⁃year OS                        probability of 5⁃year OS
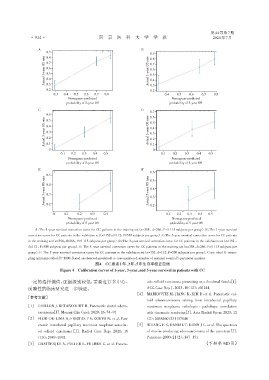
                 A:The 1⁃year survival correction curve for CC patients in the training set(n=358 . d=266,P=5 115 subjects per group). B:The 1⁃year survival
              correction curve for CC patients in the validation set(n=152,d=112,P=550 subjects per group). C:The 3⁃year survival correction curve for CC patients
              in the training set(n=358,d=266,P=5 115 subjects per group). D:The 3⁃year survival correction curve for CC patients in the validation set(n=152 ,
              d=112 ,P=550 subjects per group). E:The 5⁃year survival correction curve for CC patients in the training set(n=358,d=266,P=5 115 subjects per
              group). F:The 5⁃year survival correction curve for CC patients in the validation set(n=152,d=112,P=550 subjects per group). Gray:ideal X⁃resam⁃
              pling optimism added,B=1000,Based on observed⁃predicted. n:case number;d:number of terminal events;P:parameter number.
                                             图4 CC患者1年、3年、5年生存率校正曲线
                             Figure 4 Calibration curves of 1⁃year,3⁃year,and 5⁃year survival in patients with CC

              一定的选择偏倚,证据级别较低,需要进行多中心、                                atic colloid carcinoma presenting as a duodenal fistula[J].
              前瞻性的临床研究进一步验证。                                         ACG Case Rep J,2023,10(12):e01244
                                                                [4] MARKOVITZ M,JIANG K,KIM D,et al. Pancreatic col⁃
             [参考文献]
                                                                     loid adenocarcinoma arising from intraductal papillary
             [1] DHILLON J,BETANCOURT M. Pancreatic ductal adeno⁃    mucinous neoplasm:radiologic ⁃ pathologic correlation
                   carcinoma[J]. Monogr Clin Cytol,2020,26:74-91     with cinematic rendering[J]. Acta Radiol Open,2023,12
             [2] FLOR⁃DE⁃LIMA B,FREITAS P S,COUTO N,et al. Pan⁃     (2):20584601231157046
                   creatic intraductal papillary mucinous neoplasm associat⁃  [5] WHANG E E,DANIAL T,DUNN J C,et al. The spectrum
                   ed colloid carcinoma[J]. Radiol Case Rep,2021,16  of mucin⁃producing adenocarcinoma of the pancreas[J].
                  (10):2989-2992                                     Pancreas,2000,21(2):147-151
             [3] CHATTERJEE A,FULLER L,FULMER C,et al. Pancre⁃                                 (下转第940页)
   25   26   27   28   29   30   31   32   33   34   35