Page 35 - 南京医科大学自然版
P. 35

第44卷第7期          苏思璇,尚彦星,段程伟,等. 基于生信分析对脓毒症相关性脑病中神经炎症相关核心基因
                  2024年7月                 的筛选[J]. 南京医科大学学报(自然科学版),2024,44(7):915-926                    ·919 ·


                         A      1.0                                  B
                                                                         1 200
                                         ★  β=7,R =0.86                  1 100
                                0.8
                            Scale free topology model  R 2  signed  fit,  -0.2  Mean connectivity 1 000
                                               2
                                0.6
                                                                          900
                                0.4
                                                                          800
                                                                          700
                                0.2
                                                                          600
                                0.0
                                                                          500
                                                                          400
                                                                          300
                               -0.4
                               -0.6
                                                                          100
                               -0.8                                       200 0    ★ β=7,14.59
                                    2 4 5 6 10 12 14 16 18 20 22 24 26 28 30   2 4 5 6 10 12 14 16 18 20 22 24 26 28 30
                                           Soft⁃threshold(power)                     Soft⁃threshold(power)
                C                                        D
                         1.0                                       Correlation coefficient  P value
                         0.9
                                                                  -0.5  0  0.5     00  0.05  0.10
                        Height  0.8                         0.12           7.3e -0.12          7.3e -4 -6  Dark olivegreen
                                                                              -4
                                                                           6.3e -0.16
                                                            0.16
                                                                              -6
                                                                                               6.3e
                                                                                                      Dark orange
                         0.7
                                                            0.50
                                                            0.45           2.9e -51 -0.50      2.9e -51  Brown
                                                                              -41 -0.45
                                                                                                  -41
                                                                                               6.3e
                                                                           6.3e
                                                                                                      White
                         0.6
                                                            0.15           1.3e -0.15          1.3e -5  Magenta
                                                                              -5
                                                            0.18           4.6e -0.18          4.6e -7  Light cyan
                                                                              -7
                         0.5
                                                            -0.24          2.4e -12  0.24      2.4e -12  Dark grey
                                                            0.15           2.3e -0.15          2.3e -5  Cyan
                                                                              -5
                         0.4
                                                            0.34           1.1e -23 -0.34      1.1e -23  Dark red
                 Dynamic tree cut
                                                            -0.17          7.3e -7  0.17       7.3e -7  Blue
                  Merge dynamic                             -0.23          3.9e -11  0.23      3.9e -11  Purple
                                                            0.26           4.0e -14 -0.26      4.0e -14  Salmon
                                                            -0.10          5.2e -3  0.10       5.2e -3  Grey60
                                                            0.30           1.2e -18 -0.30      1.2e -18  Yellow
                                                            -0.43          4.0e -38  0.43      4.0e -38  Black
                                                            -0.38          8.3e -29  0.38      8.3e -29  Orange
                                                            -0.12          4.5e -4  0.12       4.5e -4  Paleturquoise
                                                            -0.29          3.3e -17  0.29      3.3e -17  Steel blue
                                                            -0.18          2.4e -7  0.18       2.4e -7  Royal blue
                                                            -0.36          1.2e -25  0.36      1.2e -25  Sky blue
                                                                              -5
                                                            0.15           1.9e -0.15             -5  Grey
                E                                                                              1.9e
                   0.15                                         Control group        Sepsis group
                  Height  0.10
                   0.05
                     0
                                                        Salmon    Distance    F
                                                        Yellow
                                                        Brown                         P=4.3e-1.04,r=0.72
                                                        White    .0 0.5 1.0 1.5
                                                        Magenia                   1.0
                                                        Cyan
                                                        Lighte yan
                                                        Dark red                  0.5
                                                        Grey60                  Gene significances of group
                                                        Sky blue
                                                        Black                     0.0
                                                        Orange
                                                        Royal blue               -0.5
                                                        Paleturquoise
                                                        Steel blue
                                                        Dark olivegrccn             -0.5   0    0.5   1.0   1.5
                                                        Dark orange                  Module membership in brown module
                                                        Dark grey
                                                        Grey
                                                        Blue
                                                        Purple
                        Salmon  Yellow  Brown  White  Magenia  Cyan  Lighte yan  Dark red  Grey60  Sky blue  Black  Orange  Royal blue  Paleturquoise  Steel blue  Dark olivegrccn  Dark orange  Dark grey  Grey  Blue  Purple
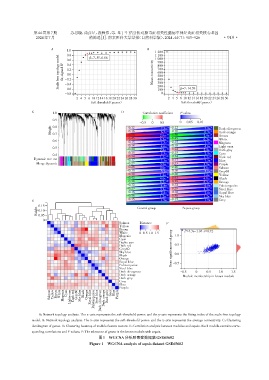
                   A:Network topology analysis. The x⁃axis represents the soft⁃threshold power,and the y⁃axis represents the fitting index of the scale⁃free topology
                model. B:Network topology analysis. The x⁃axis represents the soft⁃threshold power,and the y⁃axis represents the average connectivity. C:Clustering
                dendrogram of genes. D:Clustering heatmap of module feature vectors. E:Correlation analysis between modules and sepsis. Each module contains corre⁃
                sponding correlations and P values. F:The relevance of genes in the brown module with sepsis.
                                               图1  WGCNA分析脓毒症数据集GSE65682
                                          Figure 1 WGCNA analysis of sepsis dataset GSE65682
   30   31   32   33   34   35   36   37   38   39   40