
Page 37 - 南京医科大学自然版
P. 37
第44卷第7期 苏思璇,尚彦星,段程伟,等. 基于生信分析对脓毒症相关性脑病中神经炎症相关核心基因
2024年7月 的筛选[J]. 南京医科大学学报(自然科学版),2024,44(7):915-926 ·921 ·
A C
Response to virus
Cytokine⁃mediated signaling pathway
7.5
Regulation of response to biotic stimulus Count
40
Response to molecule of bacterial origin
P 5.0 Change Positive regulation of response to external stimulus 50
60
-lg Down Response to lipopolysaccharide 70
Not P value
2.5 Up Defense response to virus 3.07376e⁃21
Defense response to symbiont
2.30532e⁃21
Regulation of innate immune response 1.53688e⁃21
0.0 7.68441e⁃22
Patten recognition receptor signaling pathway
1.85261e⁃33
-2.5 .0 2.5 5.0 Response to interferon⁃gamma
log2FC Cellular response to interferon⁃gamma
B 0.04 0.05 0.06
Gene ratio
Group D
Cmpk2 1.5 Group Endocytic vesicle
Gbp2 Endosome membrane
Ifl44 1 Control Count
Gbp7 Cell⁃substrate junction 24
Rsad2 0.5 LPS Outer membrane 26
Slamf7 Organclle outer membrane 28
Ccl5 0 30
Saa3 Phagocytic vesicle 32
Il1β Cytophtasmic side of membrane 34
Il6 -0.5
Cxcl2 Focal adhesion P value
Il1a -1 Lysosmal membrane 2e⁃07
Irg1 Lytic vacuole membrane 1e⁃07
Lcn2 -1.5
Ccrl2 Mitochondrial outer membrane
LOC100862150 Cytoplasmic side of plasma membrane
Ndrg1
Abcd2
Cytip 0.022 5 0.025 0 0.027 5 0.030 0
Arg1
Scel Genc ratio
Atp6v0d2
Hspb7
Cxcr4 F Epstein⁃Barr virus infection
Gpr183
Serpinb1a NF⁃κB signaling pathway
Rasgrp3 Influenza A
F13a1 TNF signaling pathway
Hdac9
Ocstamp Measles
NOD⁃like receptor signaling pathway
Coronavirus disease⁃COVID⁃19
C⁃type lectin receptor signaling pathway
E
Phospholipid binding Kaposi sareoma⁃associated herpesvirusinfection P value
GTPase regulator activity Transcriptional misregulation in cancer
5.0e⁃07
Nucleoside⁃triphosphatase regulator activity Toll⁃like receptor signaling pathway 1.0e⁃06
Ubiquitin⁃like protein ligase binding Count Hepatitic C 1.5e⁃06
20
Cytokinc receptor binding Herpes simplex virus 1 infection
30
Phosphatidylinositol binding 40 Osteoclast differentiation
Ubiquitin protein ligase binding Cytosolic DNA⁃ sensing pathway
P value
GTPase activator activity 6e⁃08 Lipid and atherosclerosis
Lipid transporter activity 4e⁃08 Human cytomegalovirus infection
2e⁃08
Double⁃stranded RNA binding Chemokine signaling pathway
Antioxidant activity Pertussis
Chemokine activity IL⁃17 signaling pathway
0.01 0.02 0.03 0.04 0 20 40 60
Gene ratio Count
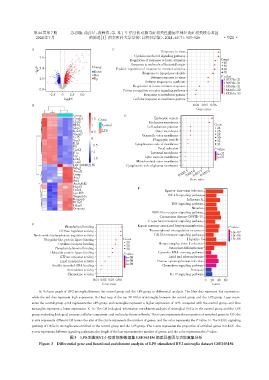
A:Volcano graph of BV2 microglia between the control group and the LPS group in differential analysis. The blue dots represent low expression,
while the red dots represent high expression. B:Heat map of the top 30 DEGs of microglia between the control group and the LPS group. Cyan repre⁃
sents the control group,pink represents the LPS group,red rectangles represent a higher expression of LPS,compared with the control group,and blue
rectangles represent a lower expression. C-E:The GO biological information enrichment analysis of microglial DEGs in the control group and the LPS
group,including biological process,cellular component,and molecular function levels. The x⁃axis represents the proportion of enriched genes in GO,the
y⁃axis represents different GO terms,the size of the circle represents the number of genes,and the color represents the P value. F:The KEGG signaling
pathway of DEGs in microglia was enriched in the control group and the LPS group. The x⁃axis represents the proportion of enriched genes in KEGG,the
y⁃axis represents different signaling pathways,the length of the bar represents the number of genes,and the color represents the P value.
图3 LPS刺激BV2小胶质细胞数据集GSE103156的差异基因与功能富集分析
Figure 3 Differential gene and functional enrichment analysis of LPS stimulated BV2 microglia dataset GSE103156