
Page 40 - 南京医科大学自然版
P. 40
第45卷第10期
·1408 · 南 京 医 科 大 学 学 报 2025年10月
A B The number of SNPs within 1 000 Mb window size C QQ⁃plot
20 21 22 1
19 10
18 2 0 Mb 22 Mb 44 Mb 66 Mb 88 Mb 110 Mb 132 Mb 154 Mb 176 Mb 197 Mb
17 0 (P) 8
16 25 3 Chr1
50
15 75 Chr2 6
100 Chr3 Observed⁃lg 4
Chr4
14 4
Chr5 2
Chr6
13 Chr7 0
5
Chr8
12 Chr9 Density 0 1 2 3
Chr10 Expected⁃lg(P)
6
11 Chr11 0
Chr12 1
7
10
Chr13 2
8
9
Chr14 3 4
Chr15 5
Chr16 6
Chr17 7
Chr18 8
Chr19 9
Chr20 10
Chr21 11
Chr22 12
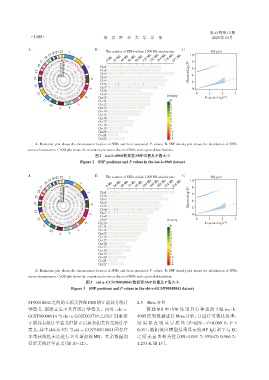
A:Manhattan plot shows the chromosomal location of SNPs and their associated P⁃values. B:SNP density plot shows the distribution of SNPs
across chromosomes. C:QQ plot shows the consistency between observed SNPs and expected distributions.
图2 ieu⁃b⁃4960数据里SNP位置及P值大小
Figure 2 SNP positions and P values in the ieu⁃b⁃4960 dataset
A 21 22 1 B The number of SNPs within 1 000 Mb window size C QQ⁃plot
19 20 10
18 2 0 Mb 24 Mb 48 Mb 72 Mb 96 Mb 120 Mb 144 Mb 168 Mb 192 Mb 216 Mb
17 0 (P) 8
16 25 3 Chr1
50 6
15 75 Chr2
Chr3 Observed⁃lg
100 4
14 4 Chr4
Chr5 2
Chr6
13 Chr7 0
Chr8
5
12 Chr9 Density 0 1 2 3
Chr10 Expected⁃lg(P)
6
11 0
Chr11
Chr12 1
7
10
2
Chr13
8
9
Chr14 3 4
Chr15 5
Chr16 6
Chr17 7
Chr18 8
Chr19 9
Chr20 10
Chr21 11
Chr22 12
A:Manhattan plot shows the chromosomal location of SNPs and their associated P⁃values. B:SNP density plot shows the distribution of SNPs
across chromosomes. C:QQ plot shows the consistency between observed SNPs and expected distribution.
图3 ebi⁃a⁃GCST90018841数据里SNP位置及P值大小
Figure 3 SNP positions and P values in the ebi⁃a⁃GCST90018841 dataset
ST90018841之间的正相关性在FDR矫正前具有统计 2.5 Meta分析
学意义,但矫正后不具有统计学意义。同时,ebi⁃a⁃ 普通 MR 中 IVW 结果具有争议的 3 组 ieu⁃b⁃
GCST90006914 与 ebi⁃a⁃GCST003739 之间在 FDR 矫 4905 结果数据进行 Meta 分析,并进行可视化处理,
正前具有统计学意义但矫正后其负相关性无统计学 结 果 存 在 明 显 异 质 性(I =82% ,τ =0.009 0,P <
2
2
意义,其中ukb⁃b⁃531与ebi⁃a⁃GCST90018841因存在 0.01),随机效应模型结果显示抗 HP IgG 水平与 EC
多重共线性无法进行贝叶斯加权MR。其余数据均 之间无显著相关性[OR=1.091 7;95%CI:0.966 2~
显示无统计学意义(图10~12)。 1.233 4,图13]。