
Page 41 - 南京医科大学自然版
P. 41
第45卷第10期 杜凯豪,侯立朝,东小鸽,等. 幽门螺杆菌与食管癌的因果关联:基于孟德尔随机化研究[J].
2025年10月 南京医科大学学报(自然科学版),2025,45(10):1404-1416 ·1409 ·
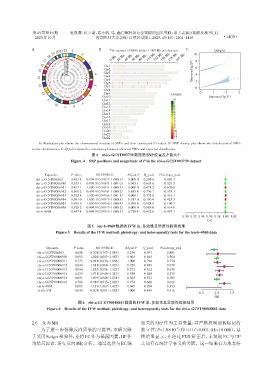
A 21 22 1 B The number of SNPs within 1 000 Mb window size C QQ⁃plot
19 20 2 10
18 0 Mb 22 Mb 44 Mb 66 Mb 88 Mb 110 Mb 132 Mb 154 Mb 176 Mb 197 Mb
17 0 3 (P) 8
16 25 Chr1 6
50
15 75 Chr2
100 4 Chr3 Observed⁃lg 4
Chr4
14 Chr5
Chr6 2
13 5 Chr7 0
Chr8
12 Chr9 Density 0 1 2 3
Chr10 Expected⁃lg(P)
6
11 Chr11 0
1
Chr12
7
10 2
Chr13
8
9
Chr14 3 4
Chr15 5
Chr16 6
Chr17 7
Chr18 8
Chr19 9
Chr20 10
Chr21 11
Chr22 12
A:Manhattan plot shows the chromosomal location of SNPs and their associated P⁃values. B:SNP density plot shows the distribution of SNPs
across chromosomes. C:QQ plot shows the consistency between observed SNPs and expected distribution.
图4 ebi⁃a⁃GCST003739数据里SNP位置及P值大小
Figure 4 SNP positions and magnitude of P in the ebi⁃a⁃GCST003739 dataset
Exposure P value OR(95%CI) Adjust P Q_pval Pleiotropy_pval
ebi⁃a⁃GCST006363 0.483 6 0.999 9(0.999 5-1.000 3) 1.000 0 0.294 8 0.467 3
ebi⁃a⁃GCST90006910 0.535 1 0.999 5(0.998 0-1.001 0) 0.963 1 0.605 6 0.529 5
ebi⁃a⁃GCST90006911 0.497 1 1.000 1(0.999 9-1.000 3) 1.000 0 0.478 2 0.670 0
ebi⁃a⁃GCST90006912 0.569 2 0.999 9(0.999 6-1.000 2) 0.853 8 0.706 1 0.378 1
ebi⁃a⁃GCST90006913 0.322 4 1.000 4(0.999 6-1.001 1) 1.000 1 0.772 6 0.316 1
ebi⁃a⁃GCST90006914 0.581 0 1.000 1(0.999 7-1.000 5) 0.747 0 0.106 4 0.425 3
ebi⁃a⁃GCST90006915 0.995 6 1.000 0(0.999 6-1.000 4) 0.995 6 0.028 9 0.104 7
ebi⁃a⁃GCST90006916 0.520 2 0.999 9(0.999 7-1.000 2) 1.000 0 0.969 0 0.514 6
ebi⁃b⁃4905 0.647 4 0.999 9(0.999 5-1.000 3) 0.728 4 0.452 6 0.497 1
0.90 0.92 0.94 0.96 0.98 1.00 1.02
OR
图5 ieu⁃b⁃4960数据的IVW法、多效性及异质性检测结果
Figure 5 Results of the IVW method,pleiotropy,and heterogeneity tests for the ieu⁃b⁃4960 data
Exposure P value OR(95%CI) Adjust P Q_pval Pleiotropy_pval
ebi⁃a⁃GCST006363 0.096 0.901(0.797-1.019) 0.240 0.397 0.801
ebi⁃a⁃GCST90006910 0.903 1.028(0.665-1.587) 0.903 0.865 0.564
ebi⁃a⁃GCST90006911 0.775 0.991(0.930-1.056) 1.000 0.724 0.754
ebi⁃a⁃GCST90006912 0.636 1.011(0.908-1.127) 0.929 0.839 0.978
ebi⁃a⁃GCST90006913 0.054 1.232(0.996-1.523) 0.272 0.612 0.636
ebi⁃a⁃GCST90006914 0.279 1.071(0.946-1.213) 0.558 0.620 0.379
ebi⁃a⁃GCST90006915 0.091 1.079(0.988-1.178) 0.305 0.531 0.103
ebi⁃a⁃GCST90006916 0.780 0.989(0.915-1.069) 0.974 0.648 0.626
ebi⁃b⁃4905 0.005 1.233(1.067-1.425) 0.045 0.704 0.353
ukb⁃b⁃531 0.650 0.001(0.001-1.128) 1.000 0.449 0.516
0.5 1.0 1.5
OR
图6 ebi⁃a⁃GCST90018841数据的IVW法、多效性及异质性检测结果
Figure 6 Results of the IVW method,pleiotropy,and heterogeneity tests for the ebi⁃a⁃GCST90018841 data
2.6 反向MR 相关的SNP 作为工具变量,并严格控制遗传标记的
为了进一步排除反向因果的可能性,本研究除 独立性(P<1.0×10 )和 LD(r =0.001,kb=10 000),最
2
⁃5
了采用Steiger检验外,还将EC作为暴露因素,HP作 终结果显示,在经过 FDR 矫正后,未发现 EC 与 HP
为结局因素,进行反向MR分析。通过选择与EC强 之间存在统计学意义的关联。这一结果有力地支持