


Page 89 - 南京医科大学自然版
P. 89
第45卷第3期              顾天昊,李沣员,徐 皓. 肌脂肪变性作为胃肠道间质瘤患者的新预后因素[J].
                  2025年3月                    南京医科大学学报(自然科学版),2025,45(3):373-381,388                     ·377 ·


                      A                BMI  Low  High              B            Sarcopenia  No  Yes
                          1.00                                         1.00
                          0.75                                         0.75
                         DFS  0.50                                    DFS  0.50
                          0.25                                         0.25
                                P=0.302                                     P=0.045
                            0                                            0
                               0   20   40  60   80  100  120               0   20   40  60   80  100  120
                                         Time(months)                                Time(months)
                      C                                            D
                                       SAI  Low  High                               VAI  Low  High
                          1.00                                         1.00
                          0.75                                         0.75
                         DFS  0.50                                    DFS  0.50

                          0.25                                         0.25
                                P=0.861                                     P=0.557
                            0                                            0
                               0   20   40  60   80  100  120               0   20   40  60   80  100  120
                                         Time(months)                                Time(months)
                      E                                            F
                                  Myosteatosis  No  Yes                             CXI  High  Low
                          1.00                                         1.00
                          0.75                                         0.75
                         DFS  0.50                                    DFS  0.50

                          0.25                                         0.25
                                P=0.048                                     P=0.029
                            0                                            0
                               0   20   40  60   80  100  120               0   20   40  60   80  100  120
                                         Time(months)                                Time(months)
                      G                                            H
                                 Risk stratification  Moderate  High      C⁃KIT mutations Exon11 Exon9 Other(Exon 13 and Wild type)
                          1.00                                         1.00
                          0.75                                         0.75
                         DFS  0.50                                    DFS  0.50                   P=0.032
                                                                                                  P=0.030
                          0.25                                         0.25
                                P=0.038
                            0                                            0
                               0   20   40  60   80  100  120               0   20   40  60   80  100  120
                                         Time(months)                                Time(months)
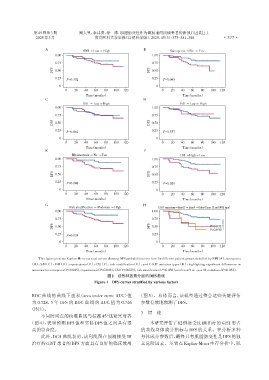
                   This figure presents Kaplan⁃Meier survival curves showing DFS probabilities over time for different patient groups stratified by BMI(A),sarcopenia
               (B),SAI(C),VAI(D),myosteatosis(E),CXI(F),risk stratification(G),and C⁃KIT mutation types(H),highlighting significant differences in
                outcomes for sarcopenia(P=0.045),myosteatosis(P=0.048),CXI(P=0.029),risk stratification(P=0.038),and exon 9 vs. exon 11 mutations(P=0.032).
                                                   图1 按各种因素分层的DFS曲线
                                             Figure 1 DFS curves stratified by various factors


                ROC 曲线的曲线下面积(area under curve AUC)值              (图 5)。总体而言,该模型通过整合这些关键评估

                为 0.728,5 年 DFS 的 ROC 曲线的 AUC 值为 0.746            参数有效地预测了DFS。
               (图3)。
                                                                  3 讨    论
                    不同时间点的校准曲线与标准45°线紧密对齐
               (图 4),表明预测 DFS 值和实际 DFS 值之间具有很                         本研究评估了82例接受过IM治疗的GIST患者
                高的符合度。                                            的基线身体成分指标与 DFS 的关系。在分析多种

                    此外,DCA 曲线表明,该列线图在预测接受 IM                      身体成分参数后,最终只有肌脂肪变性是DFS 的独
                治疗的GIST 患者的DFS 方面具有良好的临床效用                        立危险因素。尽管在 Kaplan⁃Meier 生存分析中,肌

