


Page 128 - 南京医科大学自然版
P. 128
第45卷第6期
               ·866 ·                            南 京    医 科 大 学 学         报                        2025年6月


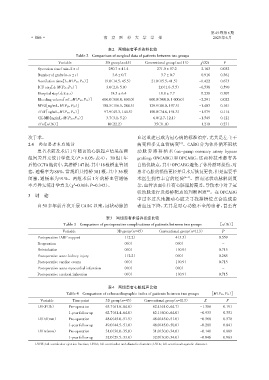
                                                   表2 两组患者手术资料比较
                                    Table 2 Comparison of surgical data of patients between two groups
                                                                                              2
                            Variable              3D group(n=45)    Conventional group(n=113)  χ /Z/t   P
                   Operation time(min,x ± s)       250.7 ± 41.4           271.0 ± 57.2        2.163    0.032
                   Number of grafts(n,x ± s)        03.6 ± 0.7            03.7 ± 0.7          0.916    0.361
                   Ventilation time[h,M(P25,P75)]  019.0(14.5,45.5)   021.0(15.5,41.5)000.   -0.422    0.673
                   ICU stay[d,M(P25,P75)]       003.0(2.0,5.0)          002.0(1.0,5.5)       -0.538    0.590
                   Hospital stay(d,x ± s)           18.5 ± 6.4            18.8 ± 7.7          0.238    0.307
                   Bleeding volume[mL,M(P25,P75)]  600.0(500.0,800.0)  600.0(500.0,1 000.0)  -2.291    0.022
                   MYO[ng/mL,M(P25,P75)]        188.5(116.5,284.5)    129.9(88.0,197.5)00.   -1.403    0.161
                   cTnT[ng/mL,M(P25,P75)]       097.9(45.3,144.5)     150.0(74.6,194.3)00.   -1.579    0.114
                   CK⁃MB[ng/mL,M(P25,P75)]      003.7(3.1,5.2)        006.0(2.7,12.1)0000.   -1.549    0.121
                   cTnI[n(%)]                   00.10(22.2)           00.35(31.0)00000000     1.210    0.271


              次手术。                                              血运重建已成为冠心病的标准治疗,尤其是左主干
                                                                                   [3]
              2.4  两组患者术后随访                                     病变和多支血管病变 。CABG 分为体外循环冠状
                  患者术前及术后1年随访的心脏超声结果在两                          动 脉 旁 路 移 植 术(on ⁃ pump coronary artery bypass
              组间差异无统计学意义(P > 0.05,表 4)。3D组1年                    grafting,ONCABG)和 OPCABG,这两种技术都有各
              后的CCTA随访中,共搭桥147根,其中18根桥血管闭                       自的优缺点,其中OPCABG避免了体外循环损伤,对
              塞,通畅率为88%,常规组共搭桥381根,其中36根                        患者心脏的损伤更轻并且术后恢复更快,但是需要手
              闭塞,通畅率为 91%。两组术后 1 年的桥血管通畅                        术医生拥有丰富的经验            [4-5] 。然而冠状动脉解剖复
              率差异无统计学意义(χ =0.903,P=0.342)。                      杂,血管表面往往有心脏脂肪覆盖,导致术中对于冠
                                   2
                                                                                                [6]
                                                                状动脉走行及搭桥靶点的判断困难 。在OPCABG
              3  讨 论
                                                                中过多过久地搬动心脏去寻找搭桥位点会造成患
                  自50多年前首次开展CABG 以来,冠状动脉的                       者血压下降,尤其是对心功能不全的患者,甚至有

                                                  表3 两组患者术后并发症比较
                              Table 3 Comparison of postoperative complications of patients between two groups  [n(%)]
                              Variable                 3D group(n=45)     Conventional group(n=113)     P
                  Postoperative IABP support               1(2.2)                 4(3.5)              0.559
                  Reoperation                              0(0)0.                 0(0)0.                -
                  Reintubation                             0(0)0.                 1(0.9)              0.715
                  Postoperative acute kidney injury        1(2.2)                 0(0)0.              0.285
                  Postoperative cardiac events             0(0)0.                 1(0.9)              0.715
                  Postoperative acute myocardial infarction  0(0)0.               0(0)0.                -
                  Postoperative cerebral infarction        0(0)0.                 1(0.9)              0.715

                                                   表4 两组患者心脏超声比较
                                Table 4 Comparison of echocardiographic index of patients between two groups  [M(P25,P75)]
                    Variable       Time point     3D group(n=45)    Conventional group(n=113)  Z          P
                  LVEF(%)        Pre⁃operation    63.7(61.6,64.8)       62.4(61.0,64.7)      -1.306     0.191
                                 1⁃year follow up  62.7(61.4,64.0)      62.1(60.0,64.0)      -0.933     0.351
                  LVDd(mm)       Pre⁃operation    48.0(45.0,51.5)       48.0(45.0,51.0)      -0.568     0.570
                                 1⁃year follow up  49.0(44.5,51.0)      48.0(45.0,50.0)      -0.201     0.841
                  LVDs(mm)       Pre⁃operation    31.0(30.0,35.0)       31.0(30.0,34.0)      -0.140     0.889
                                 1⁃year follow up  32.0(29.5,33.0)      32.0(30.0,34.0)      -0.046     0.963
                 LVEF:left ventricular ejection fraction;LVDd:left ventricular end⁃diastolic diameter;LVDs:left ventricualr⁃systolic diameter.

