Page 12 - 《南京医科大学学报》2026年第1期
P. 12

第46卷第1期
               · 6  ·                            南 京    医 科 大 学 学         报                        2026年1月


              A              CRC_GSE166555                                         THBS2
                                                                                                      4.0
                                     Plasma
                                                   Cell type(major⁃lineage)                           3.5
                                                     B
                                        Fibroblasts  CD4Tconv                                         3.0
                                                     CD8T
                            Epithelia                DC
                                      CD4TconV                                                        2.5
                                                     Endothelial
                                      Myofibroblasts
                                  CD8T               Epithelial
                                                     Fibroblasts                                      2.0
                         Malignant  Tprolif          Malignant
                                          Mast
                                                     Mast                                             1.5
                                                     Mono/Macro
                                                     Myofibroblasts
                                      Mono/Macro                                                      1.0
                                     DC              Plasma
                                       Endothelial   Tprolif
                                                                                                      0.5
                                B
                                                                                                      0
              B                                            C             FAP                  THBS2
                     (log2 TPM)  15  Cancer associated fibroblast_EPIC
                                             r=0.931
                                            P<0.001
                     expression level  10  COAD                 100 μm  DAPI          100 μm  Merge


                     THBS2  5 0


                            0   0.25  0.50  0.75  1.00
                                Infiltration level
                                                                100 μm                100 μm

              D                NF     CAF                   6                         NF
                                                           Relative expression of protein
                     Vimentin               70 kDa                      *     *       CAF

                      α⁃SMA                 45 kDa          4

                        FAP                 100 kDa         2    *


                      GAPDH                 35 kDa          0
                                                              Vimentin  α⁃SMA  FAP
                                                                               F             P=0.04
                                                    4                                800
                                                   Relative THBS2 expression  2      400
              E                                             *
                        NF      CAF                 3                               expression  600
                THBS2                 130 kDa

               GAPDH                  35 kDa        1                               Relative THBS2  200


                                                    0                                  0
                                                        NF    CAF                          NF   CAF
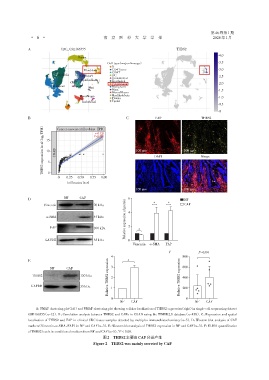
                  A:UMAP clustering plot(left)and UMAP clustering plot showing cellular localization of THBS2 expression(right)in single⁃cell sequencing dataset
              GSE166555(n=12). B:Correlation analysis between THBS2 and CAFs in COAD using the TIMER2.0 database(n=458). C:Expression and spatial
              localization of THBS2 and FAP in clinical CRC tissue samples detected by multiplex immunohistochemistry(n=5). D:Western blot analysis of CAF
              markers(Vimentin,α⁃SMA,FAP)in NF and CAF(n=3). E:Western blot analysis of THBS2 expression in NF and CAF(n=3). F:ELISA quantification
                                                        *
              of THBS2 levels in conditioned medium from NF and CAF(n=5). P < 0.05.
                                                 图2  THBS2主要由CAF分泌产生
                                            Figure 2  THBS2 was mainly secreted by CAF
   7   8   9   10   11   12   13   14   15   16   17