


Page 111 - 南京医科大学自然版
P. 111
第46卷第10期        李江鹏,唐立钧,李天女,等. F⁃FDG PET/CT代谢参数预测胃癌原发灶HER2低表达状态[J].
                                                      18
                 2026年10月                    南京医科大学学报(自然科学版),2026,46(10):1536-1544                     ·1541 ·


                                                                                                        A


                                                                                                        B


                                                                                                        C
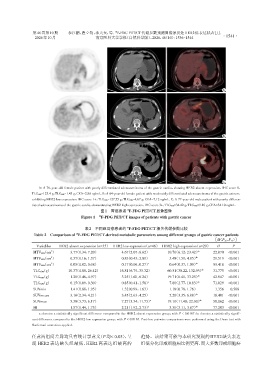
                   A:A 76⁃year⁃old female patient with poorly differentiated adenocarcinoma of the gastric cardia,showing HER2 absent expression,IHC score 0,
                TLG40%=123.4 g,TLG80%=1.43 g,CEA=2.86 ng/mL. B:A 64⁃year⁃old female patient with moderately differentiated adenocarcinoma of the gastric antrum,
                exhibiting HER2 low expression,IHC score 1+,TLG40%=127.55 g,TLG80%=4.67 g,CEA=7.12 ng/mL. C:A 77⁃year⁃old male patient with poorly differen⁃
                tiated adenocarcinoma of the gastric cardia,demonstrating HER2 high expression,IHC score 3+,TLG40%=34.42 g,TLG80%=9.16 g,CEA=34.10 ng/mL.
                                                            18
                                               图1 胃癌患者 F⁃FDG PET/CT显像图像
                                      Figure 1  18 F⁃PDG PET/CT images of patients with gastric cancer

                                                            18
                                        表2 不同组胃癌患者的 F⁃FDG PET/CT 相关代谢参数比较
                 Table 2 Comparison of F⁃FDG PET/CT⁃derived metabolic parameters among different groups of gastric cancer patients
                                    18
                                                                                                    [M(P25,P75)]
                  Variables  HER2 absent expression(n=35) HER2 low expression(n=46) HER2 high expression(n=29)  H  P
                MTV40% (cm )     3.77(1.34,7.20)         4.67(2.07,8.62) a    10.70(6.12,23.42)00  22.070  <0.001
                         2
                                                                                            ab
                MTV60% (cm )     0.37(0.16,1.37)         0.83(0.43,2.09) a     3.48(1.59,4.85)00   29.519  <0.001
                         2
                                                                                           ab
                MTV80% (cm )     0.05(0.02,0.08)         0.17(0.06,0.27) a     0.64(0.37,1.05)00   55.418  <0.001
                                                                                           ab
                         2
                TLG40% (g)       10.37(4.88,26.42)      16.81(6.79,35.32) a   60.51(30.22,132.95)  31.775  <0.001
                                                                                              ab
                TLG60% (g)       1.28(0.46,4.97)         3.25(1.60,6.24) a    19.71(8.41,33.25)00  42.647  <0.001
                                                                                            ab
                TLG80% (g)       0.15(0.09,0.30)         0.85(0.41,1.58) a     7.80(2.77,10.83)0   71.029  <0.001
                                                                                            ab
                SUVmin           1.41(0.88,1.95)         1.32(0.99,1.63) a     1.18(0.78,1.76)00 ab  1.356  0.508
                                                                                           ab
                SUVmean          3.16(2.34,4.21)         3.45(2.63,4.25) a     5.26(3.35,6.88)00   18.401  <0.001
                                                                                             ab
                SUVmax           5.30(3.73,6.17)        07.27(5.54,11.73) a   19.10(11.48,22.00)0  58.162  <0.001
                                                                                           ab
                HI               1.57(1.44,1.75)         2.21(1.92,2.73) a     3.30(3.11,3.87)00   77.203  <0.001
                   a:denotes a statistically significant difference compared to the HER2 absent expression group,with P < 0.0167;b:denotes a statistically signifi⁃
                cant difference compared to the HER2 low expression group,with P < 0.0167. Post⁃hoc pairwise comparisons were performed using the Dunn test with
                Bonferroni correction applied.
                任意两组间差异均具有统计学意义(P均< 0.05),呈                       趋势。该结果可能与本研究发现的HER2缺失表达
                现 HER2 表达缺失组最低,HER2 高表达组最高的                       组低分化印戒细胞癌比例更高,而大多数印戒细胞癌

