


Page 58 - 南京医科大学自然版
P. 58
第46卷第10期
               ·1488 ·                           南 京    医 科 大 学 学         报                        2026年10月


              A                                                                     B
                          Bright⁃field         TUNEL               Merge
                                                                                         100
                                                                                                  **
                                                                                          80             **##
                   Control                                                              (%)  60      △△
                                                                                        TUNEL  40


                                                                                          20
                   OGD                                                                    0
                                                                                           Control OGD NC Antagomir
                                                                                    C     15
                                                                                                  **      #
                                                                                        (%)
                   NC                                                                     10         △△
                                                                                        Apoptosis rate  5


                   antagomir


                                                                                           0
                                                                                           Control OGD NC Antagomir

              D          Control                  OGD                     NC                    Antagomir
                   10 7                   10 7                     10 7                   10 7
                    Q1⁃1       Q1⁃2         Q1⁃1        Q1⁃2        Q1⁃1       Q1⁃2        Q1⁃1        Q1⁃2
                    9.86%      3.37%        7.31%       4.94%       9.82%      2.51%       10.99%      5.24%
                   10 6                   10 6                     10 6                   10 6
                 PerCP⁃H  10 5  10 4    PerCP⁃H  10 5  10 4      PerCP⁃H  10 5  10 4    PerCP⁃H  10 5  10 4


                    Q1⁃3       Q1⁃4         Q1⁃3        Q1⁃4        Q1⁃3       Q1⁃4        Q1⁃3        Q1⁃4
                   10 2.2  83.38%  3.38%  10 2.1  78.00%  9.76%    10 1.9  85.42%  3.35%  10 2  80.42%  3.35%
                   10 3.2  10 5  10 7  10 9.3  10 3.1  10 5  10 7  10 9.3  10 3.3  10 5  10 7  10 9.3  10 3.1  10 5  10 7  10 9.3
                         FITC⁃H                  FITC⁃H                  FITC⁃H                 FITC⁃H

                                                       F  0.4                      G   0.8
              E                                           0.3         * △△             0.6      **
                         Control  OGD  NC  Antagomir     protein expression                        △△  **#

                  Bcl⁃2                    26 kDa         0.2      **     **##        Bax protein expression  0.4

                   Bax                     21 kDa         0.1                          0.2
                                                         Bcl⁃2
                β⁃actin                    42 kDa                                        0
                                                            0
                                                            Control  OGD  NC Antagomir   Control  OGD  NC Antagomir


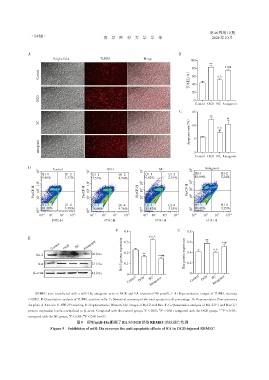
                 RBMEC were transfected with a miR⁃18a antagomir prior to OGD and EA treatment(50 μmol/L). A:Representative images of TUNEL staining
             (×200). B:Quantitative analysis of TUNEL⁃positive cells. C:Statistical summary of the total apoptotic cell percentage. D:Representative flow cytometry
              dot plots of Annexin V⁃FITC/PI staining. E:Representative Western blot images of Bcl⁃2 and Bax. F,G:Quantitative analysis of Bcl⁃2(F)and Bax(G)
              protein expression levels,normalized to β⁃actin. Compared with the control group,P < 0.05,P < 0.01;compared with the OGD group, P < 0.01;
                                                                   *
                                                                          **
                                                                                                      △△
                                       ##
                                 #
              compared with the NC group,P < 0.05,P < 0.01(n=3).
                                    图5   抑制miR⁃18a阻断了EA对OGD损伤RBMEC的抗凋亡作用
                        Figure 5 Inhibition of miR⁃18a reverses the anti⁃apoptotic effects of EA in OGD⁃injured RBMEC

