


Page 59 - 南京医科大学自然版
P. 59
第46卷第10期             刘怡珂,李超凡,宋海燕,等. 鞣花酸靶向miR⁃18a/TSP⁃1轴减轻缺血性脑损伤[J].
                 2026年10月                    南京医科大学学报(自然科学版),2026,46(10):1479-1491                     ·1489 ·


                 A        Bright⁃field    Hoechst         EdU            Merge
                                                                                     B   100
                     Control                                                              80
                                                                                        (%)  60      △△

                                                                                        EdU  40  **      ##
                     OGD                                                                  20

                                                                                          0
                                                                                           Control  OGD  Antagomir
                                                                                                     NC
                     NC
                                                                                            Control  OGD  NC
                                                                                   C                     Antagomir
                                                                                   Cyclin D1                34 kDa
                     Antagomir                                                       β⁃actin                29 kDa
                                                                                     PCNA
                                                                                                            42 kDa

                 D     0.8         △△             E     0.4         △△              G    400
                      PCNA protein expression  0.6  **  **##  Cyclin D1 protein expression  0.3  **  **##  Cell migration number  300  **  △△  **##


                                                        0.2
                       0.4
                                                                                         200
                                                        0.1
                       0.2
                                                                                         100
                        0
                        Control  OGD  NC                 0 Control  OGD  NC Antagomir      0 Control  OGD  NC
                                   Antagomir
                                                                                                     Antagomir
                  F       Control        OGD             NC           Antagomir


                                                                                     I
                                                                                         400
                                                                                        Number of nodes  200  **  **##
                  H       Control        OGD             NC           Antagomir          300         * △△

                                                                                         100

                                                                                           0
                                                                                           Control  OGD  NC
                                                                                                     Antagomir
                  J       Control        OGD             NC           Antagomir


                                                                            100 nm

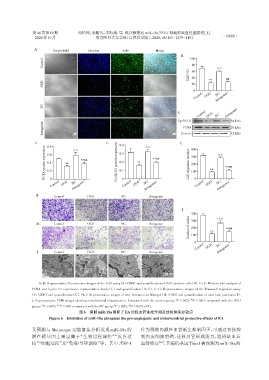
                   A,B:Representative fluorescence images of the EdU assay(A,×200)and quantification of EdU⁃positive cells(B). C-E:Western blot analysis of
                PCNA and Cyclin D1 expression:representative bands(C)and quantification(D,E). F,G:Representative images of the Transwell migration assay
               (F,×200)and quantification(G). H,I:Representative images of tube formation on Matrigel(H,×100)and quantification of total tube junctions(I).
                                                                                  *
                                                                                         **
                J:Representative TEM images showing mitochondrial ultrastructure. Compared with the control group,P < 0.05,P < 0.01;compared with the OGD
                    △      △△                         #     ##
                group,P < 0.05, P < 0.01;compared with the NC group,P < 0.05,P < 0.01(n=3).
                                      图6  抑制miR⁃18a阻断了EA的促血管生成作用及线粒体保护效应
                        Figure 6  Inhibition of miR⁃18a abrogates the pro⁃angiogenic and mitochondrial protective effects of EA
                叉预测与 Metascape 功能富集分析发现 miR⁃18a 的                 作为强效内源性血管新生抑制因子,可通过直接抑
                潜在靶基因主要富集于“生物过程调控”“发育过                            制内皮细胞增殖、迁移及管形成能力,阻碍缺血后

                程”“细胞过程”及“免疫/节律调控”等。其中,TSP⁃1                      血管修复    [24] ,其编码基因Thbs1被预测为miR⁃18a的

