
Page 13 - 《南京医科大学学报(自然科学版)》2026年第3期
P. 13
第46卷第3期 刘志洁,陶子琦,黄 希,等. 脂质摄取在卵巢癌微环境中诱导CD4+调节性T细胞表达PD⁃1和CTLA⁃4
2026年3月 的作用[J]. 南京医科大学学报(自然科学版),2026,46(3):315-323 ·321 ·
A B
Unstained Medium CAOV3 TSN 100 * * * Medium
10 7 10 7 10 7 CAOV3 TSN
10 6 10 6 10 6 96.3% 80
1.2% 10 5 41.9% 10 5 (%)
5
10
SSC⁃A 10 4 3 10 4 3 10 4 3 60
10
0 10 0 10 0 CD4 + Treg 40
-10 3 -10 3 -10 3
20
5
5
4
4
4
5
0 10 10 10 6 0 10 10 10 6 0 10 10 10 6
BODIPY493/503 0
BODIPY493/503 PD⁃1 CTLA⁃4
Medium DMSO Medium CAOV3 TSN
2.0×10 6 2.0×10 6 2.0×10 6 2.0×10 6
1.5×10 6 1.5×10 6 1.5×10 6 1.5×10 6
SSC⁃A 1.0×10 6 7.9% 1.0×10 6 75.0% SSC⁃A 1.0×10 6 6.0% 1.0×10 6 77.7%
0.5×10 6 0.5×10 6 0.5×10 6 0.5×10 6
0 0 0 0
5
3
4
4
3
5
4
4
-10 0 10 3 10 10 5 -10 0 10 3 10 10 5 0 10 10 10 6 0 10 10 10 6
PD⁃1 CTLA⁃4
C Unstained DMSO D **
2.0×10 6 2.0×10 6 50
1.5×10 6 1.5×10 6 40
SSC⁃A 1.0×10 6 1.1% 1.0×10 6 41.7% (%) 30
0.5×10 6 0.5×10 6 PD⁃1 + 20
0 0 10
4
3
4
3
-10 0 10 3 10 10 5 -10 0 10 3 10 10 5
0
Etomoxir C75 SSO
Etomoxir
2.0×10 6 2.0×10 6 2.0×10 6 DMSO C75 SSO
1.5×10 6 1.5×10 6 1.5×10 6
40.9% 40.4% 18.5%
1.0×10 6 1.0×10 6 1.0×10 6
0.5×10 6 0.5×10 6 0.5×10 6
0 0 0
3
4
3
4
4
3
-10 0 10 3 10 10 5 -10 0 10 3 10 10 5 -10 0 10 3 10 10 5
PD⁃1
E Unstained DMSO F 90 *
2.0×10 6 2.0×10 6 80
6 6
1.5×10 0.33% 1.5×10 83.3% (%)
SSC⁃A 1.0×10 6 1.0×10 6 70
0.5×10 6 0.5×10 6 CTLA⁃4 + 60
0 0 50
3
4
3
4
-10 0 10 3 10 10 5 -10 0 10 3 10 10 5
40
Etomoxir C75 SSO DMSO Etomoxir C75 SSO
2.0×10 6 2.0×10 6 6
2.0×10
1.5×10 6 1.5×10 6 1.5×10 6
65.7% 71.3% 51.0%
1.0×10 6 1.0×10 6 6
1.0×10
0.5×10 6 0.5×10 6 0.5×10 6
0 0 0
3
4
4
3
-10 0 10 3 10 10 5 -10 0 10 3 10 10 5 -10 0 10 3 10 10 5
4
3
CTLA⁃4
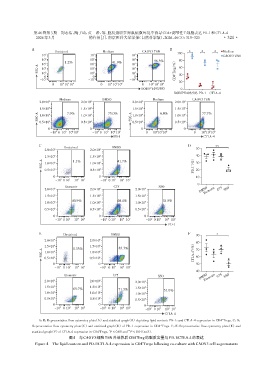
A,B:Representative flow cytometry plots(A)and statitical graph(B)depicting lipid content,PD⁃1,and CTLA⁃4 expression in CD4 Tregs. C,D:
+
+
Representative flow cytometry plots(C)and statitical graph(D)of PD⁃1 expression in CD4 Tregs. E,F:Representative flow cytometry plots(E)and
+
**
*
statitical graph(F)of CTLA⁃4 expression in CD4 Tregs. P < 0.05 and P < 0.01(n=3).
图4 与CAOV3细胞TSN共培养后CD4 Treg的脂质含量与PD⁃1/CTLA⁃4的表达
+
+
Figure 4 The lipid content and PD⁃1/CTLA⁃4 expression in CD4 Tregs following co⁃culture with CAOV3 cell supernatants