
Page 20 - 《南京医科大学学报(自然科学版)》2026年第3期
P. 20
第46卷第3期
·328 · 南 京 医 科 大 学 学 报 2026年3月
表3 CR组和N⁃CR组化疗前后腰椎MRI定量参数变化及临床指标比较
Table 3 Comparison of quantitative parameters and clinical indicators of lumbar spine MRI before and after chemotherapy
in the CR group and N⁃CR group
Indicator N⁃CR group(n=25) CR group(n=54) P
Sex[n(%)] 0.375
Male 11(44.0) 32(59.3)
Female 14(56.0) 22(40.7)
Age[months,M(P25,P75 )] 48(36,60) 48(36,108) 0.395
Risk factor[n(%)] < 0.001
Low⁃risk 3(12.0) 5(20.9)
Medium⁃risk 21(84.0) 40(74.1)
High⁃risk 1(4.0) 9(6.0)
LDH[U/L,M(P25,P75 )] 1 107.40(497.63,1 717.16) 1 172.50(701.04,1 643.96) 0.861
WBC[×10 ,M(P25,P75 )] 15.18(5.31,25.07) 27.43(5.78,49.08) 0.299
9
Primitive naive lymphocytes(%,x ± s) 84.12 ± 12.91 80.04 ± 15.48 0.294
Before chemotherapy PDFF[%,M(P25,P75 )] 3.06(1.90,3.66) 3.00(2.07,3.79) 0.601
After chemotherapy PDFF(%,x ± s) 25.83 ± 14.21 37.47 ± 15.63 0.005
Before chemotherapy R2(S ,x ± s) 84.29 ± 14.52 91.45 ± 26.23 0.197
*
-1
After chemotherapy R2[S ,M(P25,P75 )] 110.08(99.67,158.05) 158.66(140.62,172.43) 0.008
*
-1
Before chemotherapy f(x ± s) 0.49 ± 0.15 0.52 ± 0.10 0.432
After chemotherapy f(x ± s) 0.45 ± 0.14 0.49± 0.09 0.198
Before chemotherapy D[×10 mm /s,M(P25,P75 )] 0.28(0.33,0.52) 0.41(0.26,0.34) 0.024
2
-3
After chemotherapy D[×10 mm /s,M(P25,P75 )] 0.34(0.22,0.61) 0.30(0.25,0.34) 0.116
-3
2
Before chemotherapy D[×10 mm /s,M(P25,P75 )] 49.16(44.48,73.42) 115.98(36.40,195.57) 0.030
2
*
-3
After chemotherapy D[×10 mm /s,M(P25,P75 )] 108.02(36.95,179.09) 57.74(44.40,71.00) 0.163
*
-3
2
A B 300
(%) 60 (S -1 ) 250
Afer chemotherapy PDFF 40 Afer chemotherapy R2 * 200
150
20
0 100
50
CR group(n=25) N⁃CR group(n=54) CR group(n=25) N⁃CR group(n=54)
mm 2 /s) 1 000 (×10 -3 mm 2 /s) 1 000
C D
(×10 -3 800 800
Before chemotherapy D 400 Before chemotherapy D * 400
600
600
200
200
0
CR group(n=25) N⁃CR group(n=54) 0 CR group(n=25) N⁃CR group(n=54)
*
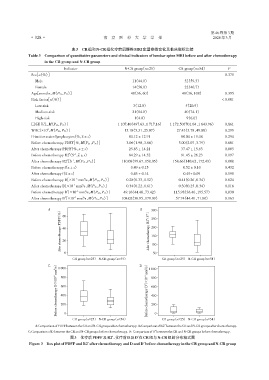
A:ComparisonofPDFFbetweentheCRandN⁃CRgroupsafterchemotherapy.B:ComparisonofR2 betweentheCRandN⁃CRgroupsafterchemotherapy.
*
C:Comparison of D between the CR and N⁃CR groups before chemotherapy. D:Comparison of D between the CR and N⁃CR groups before chemotherapy.
图3 化疗后PDFF及R2 、化疗前D及D 在CR组与N⁃CR组的分布箱式图
*
*
Figure 3 Box plot of PDFF and R2 after chemotherapy and D and D before chemotherapy in the CR group and N⁃CR group
*
*