Page 21 - 《南京医科大学学报(自然科学版)》2026年第3期
P. 21

第46卷第3期         杨   洁,孙惠苗,杨 宏,等. IDEAL⁃IQ及IVIM定量参数评价B⁃ALL患儿危险度分层及预测
                  2026年3月          早期化疗反应的初步研究[J]. 南京医科大学学报(自然科学版),2026,46(3):324-332                   ·329 ·
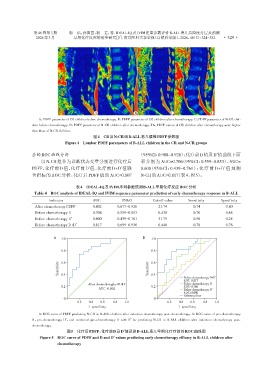


                                             A                 B                C                 D
                   A:PDFF parameter of CR children before chemotherapy. B:PDFF parameter of CR children after chemotherapy. C:PDFF parameter of N⁃CR chil⁃
                dren before chemotherapy. D:PDFF parameter of N⁃CR children after chemotherapy. The PDFF values of CR children after chemotherapy were higher
                than those of N⁃CR children.
                                            图4 CR及N⁃CR组B⁃ALL患儿腰椎PDFF参数图
                               Figure 4 Lumbar PDFF parameters of B⁃ALL children in the CR and N⁃CR groups


                应的ROC曲线分析                                        (95%CI:0.968~0.926);化疗前D值及D 值曲线下面
                                                                                                     *
                    以N⁃CR 组作为诊断状态变量分别进行化疗后                        积分别为 AUC=0.706(95%CI:0.559~0.853)、AUC=
                PDFF、化疗前 D 值、化疗前 D 值、化疗前 D+D 值联                   0.600(95%CI:0.439~0.761);化疗前 D+D 值预测
                                                                                                         *
                                          *
                                                         *
                合指标的 ROC 分析,化疗后 PDFF 值的 AUC=0.807                 N⁃CR的AUC=0.817(表4,图5)。
                                    表4 IDEAL⁃IQ及IVIM序列参数预测B⁃ALL早期化疗反应ROC分析
                 Table 4 ROC analysis of IDEAL⁃IQ and IVIM sequence parameter prediction of early chemotherapy response in B⁃ALL
                        Indicator           AUC          95%CI          Cut⁃off value   Sensitivity    Specificity
                 After chemotherapy PDFF    0.802      0.677-0.926        21.74           0.74           0.80
                 Before chemotherapy D      0.706      0.559-0.853        0.430           0.70           0.68
                 Before chemotherapy D *    0.600      0.439-0.761        31.79           0.96           0.28
                 Before chemotherapy D+D *  0.817      0.699-0.936        0.440           0.78           0.76


                          A  1.0                                   B   1.0


                             0.8                                       0.8

                            Sensitivity  0.6                         Sensitivity  0.6


                                                                       0.4
                             0.4
                                                                                      Before chemotherapy D+D *
                                                                                      AUC=0.817
                                          After chemotheraphy PDFF                    Before chemotherapy D
                             0.2                                       0.2            AUC=0.706
                                               AUC=0.802                              Before chemotherapy D  *
                                                                                      AUC=0.600
                                                                                      Reference line
                              0                                         0
                                0    0.2  0.4  0.6   0.8   1.0           0    0.2   0.4  0.6   0.8  1.0
                                          1-specificity                            1-specificity
                   A:ROC curve of PDFF predicting N⁃CR in B⁃ALL children after induction chemotherapy post⁃chemotherapy. B:ROC curve of pre⁃chemotherapy
                               *
                                                             *
                D,pre⁃chemotherapy D ,and combined pre⁃chemotherapy D with D for predicting N⁃CR in B⁃ALL children after induction chemotherapy post⁃
                chemotherapy.
                                图5   化疗后PDFF、化疗前D及D 值预测B⁃ALL患儿早期化疗疗效的ROC曲线图
                                                          *
                   Figure 5  ROC curve of PDFF and D and D values predicting early chemotherapy efficacy in B⁃ALL children after
                                                     *
                            chemotherapy
   16   17   18   19   20   21   22   23   24   25   26