Page 28 - 《南京医科大学学报(自然科学版)》2026年第3期
P. 28

第46卷第3期
               ·336 ·                            南 京    医 科 大 学 学         报                        2026年3月


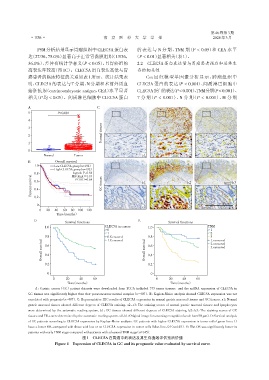
                  PSM分析结果显示胃癌组织中CLEC5A蛋白表                       的表达与 N 分期、TNM 期(P < 0.05)和 CEA 水平
              达(27/36,75.0%)显著高于正常胃黏膜组织(13/36,                 (P < 0.01)显著相关(表1)。
              36.1%),差异有统计学意义(P < 0.05),且胃癌组的                   2.2  CLEC5A蛋白表达量与胃癌患者预后和总体生
              高表达率较高(图1C)。CLEC5A蛋白表达高低与胃                        存的相关性
              癌患者的临床特征的关系如表1所示。统计结果表                                 Cox 回归模型单因素分析显示,肿瘤组织中
              明,CLEC5A 的表达与 T 分期、N 分期和术前外周血                     CLEC5A 蛋白的表达(P < 0.001)、间质淋巴细胞中
              癌胚抗原(carcinoembryonic antigen,CEA)水平显著            CLEC5A蛋白的表达(P < 0.001)、TNM分期(P < 0.001)、
              相关(P 均 < 0.05)。间质淋巴细胞中 CLEC5A 蛋白                  T 分 期(P < 0.001)、N 分 期(P < 0.001)、M 分 期


              A                               C
              5             P<0.001
              4
                                                Normal tissues
              3
              2
              1
              0
                     Normal        Tumor                           a1                  a2                   a3
              B            Overall survival
                 1.0      Low CLEC5A group(n=192)
                          High CLEC5A group(n=192)
                                   logrank P=0.64
                 0.8              HR(high)=1.10
               Percent survival  0.6  P(HR)=0.64  GC tissues       b1                  b2                50 μm  b3
                 0.4
                 0.2
                                                                                                        50 μm
                  0
                                                                   c1                  c2                   c3
                   0  20  40  60  80 100  120
                           Time(months)
                 D                                               E
                               Survival functions                              Survival functions
                      1.0                        CLEC5A in cancer    1.0                         TNM
                                                   0                                              1
                                                   1                                              2
                      0.8                          0.Censored        0.8                          3 1.censored
                                                   1.Censored
                    Overall survival  0.6                           Overall survival  0.6         2.censored
                                                                                                  3.censored
                      0.4
                                                                     0.4
                      0.2                                            0.2
                       0                                               0
                         0     20     40    60                           0     20    40     60
                                Time(months)                                    Time(months)
                 A:Gastric cancer(GC)patient datasets were downloaded from TCGA included 375 tumor tissues,and the mRNA expression of CLEC5A in
              GC tissues was significantly higher than that paracancerous normal samples(n=407). B:Kaplan⁃Meier analysis showed CLEC5A expression was not
              correlated with prognosis(n=407). C:Representative IHC results of CLEC5A expression in normal gastric mucosal tissues and GC tissues. a1:Normal
              gastric mucosal tissues showed different degrees of CLEC5A staining. a2,a3:The staining scores of normal gastric mucosal tissues and lymphocytes
              were determined by the automatic reading system. b1:GC tissues showed different degrees of CLEC5A staining. b2,b3:The staining scores of GC
              tissues and TILs were determined by the automatic reading system. a1,b1:Original image for scanning recognition(scale bar=50 μm). D:Survival analysis
              of GC patients according to CLEC5A expression by Kaplan⁃Meier analysis. GC patients with higher CLEC5A expression in tumor cells(green line,1)
              have a better OS,compared with those with low or no CLEC5A expression in tumor cells(blue line,0)(n=145). E:The OS was significantly better in
              patients with early TNM stage compared with patients with advanced TNM stage(n=145).
                                       图1   CLEC5A在胃癌中的表达及其生存曲线评估预后价值
                          Figure 1  Expression of CLEC5A in GC and its prognostic value evaluated by survival curve
   23   24   25   26   27   28   29   30   31   32   33