
Page 31 - 《南京医科大学学报(自然科学版)》2026年第3期
P. 31
第46卷第3期 古丽努尔·阿不力米提,凯迪尔耶·阿卜杜萨拉木,陆 冰,等. CLEC5A在胃癌组织中表达的临床意义及
2026年3月 与肿瘤浸润免疫细胞的相关性研究[J]. 南京医科大学学报(自然科学版),2026,46(3):333-342·339 ·
A TPM) 5 Purity P=1.51e-04 B cell_TIMER T cell CD8+_TIMER T cell CD4+_TIMER
CLEC5A Expression (log2 Level 4 3 2 STAD
Pho=0.032
Pho=-0.193
Pho=0.33
Pho=0.165
P=5.33e-01
P=4.18e-11
P=1.30e-03
0 1
0.25 0.50 0.75 1.00 0 1 2 3 4 0 0.5 1.0 1.5 0 0.5 1.0 1.5 2.0
Purity Macrophage_TIMER Neutrophil_TIMER Myeloid dendritic cell_TIMER
5 4 Pho=-0.193 P=2.77e-15 P=9.04e-14 P=2.92e-12
TPM)
CLEC5A Expression (log2 3 2 STAD
Pho=0.391
Pho=0.37
Pho=0.348
P=1.51e-04
Level
0 1
0.25 0.50 0.75 1.00
0 0.3 0.6 0.9 0 0.2 0.4 0.6 0 0.5 1.0 1.5
Infiltration level
B
0.6 P<0.001
0.5
P=0.005
P=0.035 P<0.001
0.4 P=0.622
P=0.001
P=0.001
P=0.004
0.3 P<0.001
P<0.001
P<0.001
P=0.247
0.2 P<0.001 P=0.541
P=0.691
P=0.032
P<0.001
P=0.552
0.1 P=0.928 P<0.001
P=0.752 P=0.007
T cells regulatory (Tregs)
0
B cells native T cells CD4 memory activated NK cells resting Monocytes Dendritic cells activated Eosinophils
T cells folllcular
T cells CD4 memory resting
T cells gamma delta
NK cells activated
Mast cells resting
Dendritic cells resting
T cells CD4 native
Macrophages M1
Macrophages M2
Neutrophils
B cells memory
Plasma cells
T cells CD8
Mast cells activated
Macrophages M0
T cells folllcular helper Macrophages M1 T cells CD8 NK cells activated Mast cells resting Monocytes Dendritic cells resting Plasma cells T cells regulatory B cells native B cells memory T cells gamma delta Macrophages M2 Eosinophils Macrophages M0 NK cells resting Mast cells activated Neutrophils
C T cells CD4 memory activated T cells CD4 memory resting (Tregs) Dendritic cells activated
T cells folllcular helper 1 0.12 0.22 0.1 -0.07 0.05 -0.03 0.15 -0.07 -0.06 -0.21 0.03 -0.2 -0.04 -0.04 -0.23 -0.19 -0.21 -0.08 -0.01 0.03 1.0
Macrophages M1 0.12 1 0.21 0.33 -0.26 0.01 -0.07 0.04 0.04 -0.03 0.14 0.14 -0.21 0.03 0.01 -0.01 -0.23 -0.11 -0.19 -0.23 -0.26
0.8
T cells CD8 0.22 0.21 1 0.46 -0.2 0.18 0.32 0.1 0.03 -0.12 -0.06 0.1 -0.43 0.06 -0.4 -0.17 -0.27 -0.28 -0.13 -0.04 -0.24
T cells CD4 memory activated 0.1 0.33 0.46 1 -0.26 -0.26 -0.03 -0.28 -0.18 0.11 0.04 0.05 -0.37 0.05 -0.15 0.32 -0.06 -0.02 -0.07 -0.12 -0.01
0.6
NK cells activated -0.07 -0.26 -0.2 -0.26 1 0.02 0.02 0.01 0.09 -0.09 -0.29 -0.06 0.05 -0.04 -0.14 -0.12 -0.15 -0.17 -0.01 -0.03 -0.06
Mast cells resting 0.05 0.01 0.18 -0.26 0.02 1 0.09 0.22 0.06 -0.2 -0.3 -0.07 -0.14 -0.2 -0.09 -0.26 -0.17 -0.17 -0.08 0.11 -0.03
T cells CD4 memory resting -0.03 -0.07 0.32 -0.03 0.02 0.09 1 0.13 0.16 -0.05 -0.07 0.19 0.12 -0.05 -0.37 -0.06 -0.04 -0.11 -0.12 -0.06 -0.04 0.4
Monocytes 0.15 0.04 0.1 -0.28 0.01 0.22 0.13 1 0.31 -0.16 -0.01 -0.07 -0.02 0.08 -0.13 -0.44 -0.22 -0.17 -0.13 0.02 -0.12
Dendritic cells resting -0.07 0.04 0.03 -0.18 0.09 0.06 0.16 0.31 1 -0.03 0.28 0.17 -0.03 0.07 -0.24 -0.3 -0.43 -0.14 -0.16 -0.03 -0.06 0.2
Plasma cells -0.06 -0.03 -0.12 0.11 -0.09 -0.2 -0.05 -0.16 -0.03 1 0.23 0.17 0.02 0.03 -0.03 0.33 0.17 0.16 -0.06 -0.08 -0.07
T cells regulatory(Tregs) -0.21 0.14 -0.06 0.04 -0.29 -0.3 -0.07 -0.01 0.28 0.12 1 0.24 0.08 0.21 -0.06 -0.02 -0.02 0.12 -0.29 -0.18 -0.08 0
B cells native 0.03 0.14 0.1 0.05 -0.06 -0.07 0.19 -0.07 0.17 0.17 0.24 1 0.08 0.05 -0.27 -0.1 -0.14 -0.06 -0.07 -0.18 -0.17
B cells memory -0.2 -0.21 -0.43 -0.37 0.05 -0.14 0.12 -0.02 -0.03 0.02 0.08 0.08 1 0.06 -0.15 0.01 0.11 0.01 -0.1 -0.09 -0.01 -0.2
T cells gamma delta -0.04 0.03 0.06 0.05 -0.04 -0.2 -0.05 0.08 0.07 0.03 0.21 0.05 0.06 1 -0.08 -0.03 0.01 0.07 -0.1 -0.05 -0.05
Macrophages M2 -0.04 0.01 0.4 0.15 -0.14 -0.09 -0.37 -0.13 -0.24 -0.03 -0.06 -0.27 -0.15 -0.08 1 0.09 0.26 0.08 -0.12 -0.12 -0.03 -0.4
Eosinophils -0.23 -0.01 -0.17 0.32 -0.12 -0.26 -0.06 -0.44 -0.3 0.33 -0.02 -0.1 0.01 -0.03 0.09 1 0.33 0.45 0.03 -0.1 0.1
Macrophages M0 -0.19 -0.23 -0.27 -0.06 -0.15 -0.17 -0.04 -0.22 -0.43 0.17 -0.02 -0.14 0.11 0.01 0.26 0.33 1 0.45 -0.06 -0.13 0.19 -0.6
Dendritic cells activated -0.21 -0.11 -0.26 0.02 -0.17 -0.17 -0.11 -0.17 -0.14 0.16 0.12 -0.06 0.01 0.07 0.08 0.45 0.45 1 0.05 -0.12 -0.21
NK cells resting 0.08 -0.19 -0.13 -0.07 -0.01 -0.08 -0.12 -0.13 -0.16 -0.06 -0.29 -0.07 -0.1 -0.1 -0.12 0.03 -0.06 0.05 1 -0.08 -0.06 -0.8
Mast cells activated -0.01 -0.23 -0.04 -0.12 -0.03 0.11 -0.06 0.02 -0.03 -0.08 -0.18 -0.18 -0.09 -0.06 -0.12 -0.1 -0.13 -0.12 -0.08 1 0.21
Neutrophils 0.03 0.26 -0.24 -0.01 -0.06 -0.03 -0.04 -0.12 -0.06 -0.07 -0.08 -0.17 -0.01 -0.05 -0.03 0.1 0.19 0.21 0.06 0.21 1
-1.0
+
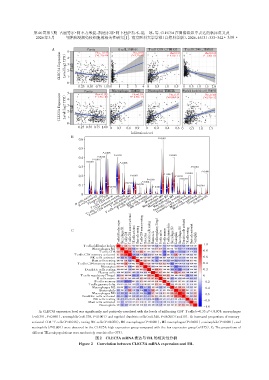
A:CLEC5A expression level was significantly and positively correlated with the levels of infiltrating CD8 T cells(r=0.33,P < 0.001,macrophages
(r=0.391,P<0.001),neutrophils(r=0.370,P<0.001)and myeloid dendritic cells(r=0.348,P<0.001)(n=415). B:Increased proportions of memory⁃
+
activated CD4 T cells(P=0.016),resting NK cells(P<0.001),M0 macrophages(P<0.001),M2 macrophages(P<0.001),eosinophils(P<0.001),and
neutrophils(P<0.001)were observed in the CLEC5A high expression group compared with the low expression group(n=375). C:The proportions of
different TILs subpopulations were moderately correlated(n=375).
图2 CLEC5A mRNA表达与TIL的相关性分析
Figure 2 Correlation between CLEC5A mRNA expression and TIL