


Page 88 - 南京医科大学自然版
P. 88
第46卷第4期
               ·556 ·                            南 京    医 科 大 学 学         报                        2026年4月


              A               B              C         *     D         *     E              F           *
                 25     *        10              15              15              30    *        100
                 (%)  20        (mm)  8         (mm)  10        (%)             (%)             (%)  80
                                                                                                 60
                 ΔLVEF 15       ΔLVDd 6 4       ΔLVDs  5        ΔLVDd% 10 5     ΔLVDs% 20       Response  40
                 10
                                                                                 10
                  5               2                                                              20
                  0               0               0              0               0                0
                     OB Non⁃OB       OB Non⁃OB       OB Non⁃OB       OB Non⁃OB      OB Non⁃OB        OB Non⁃OB
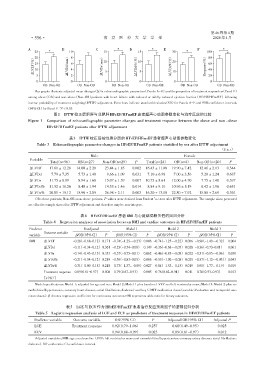
                 Bar graphs illustrate adjusted mean changes(Δ)in echocardiographic parameters(Panels A-E)and the proportion of treatment responders(Panel F)
              among obese(OB)and non⁃obese(Non⁃OB)patients with heart failure with reduced or mildly reduced ejection fraction(HFrEF/HFmrEF)following
              inverse probability of treatment weighting(IPTW)adjustment. Error bars indicate standard deviation(SD)for Panels A-E and 95% confidence intervals
                             *
             (95% CI)for Panel F. P < 0.05.
                          图1 IPTW校正后肥胖与非肥胖HFrEF/HFmrEF患者超声心动图参数变化与治疗反应的比较
              Figure 1  Comparison of echocardiographic parameter changes and treatment response between the obese and non ⁃ obese
                       HFrEF/HFmrEF patients after IPTW adjustment

                                 表3 IPTW校正后按性别分层的HFrEF/HFmrEF患者超声心动图参数变化
                  Table 3 Echocardiographic parameter changes in HFrEF/HFmrEF patients stratified by sex after IPTW adjustment
                                                                                                       (x ± s)
                                           Male                                       Female
               Variable
                        Total(n=56)  OB(n=27)   Non⁃OB(n=29)   P     Total(n=24)  OB(n=4)   Non⁃OB(n=20)   P
               ΔLVEF    17.60 ± 12.28  14.00 ± 2.20  23.44 ± 1.85  0.002  16.43 ± 11.88  19.90 ± 7.42  12.46 ± 2.03  0.344
               ΔLVDd     7.79 ± 7.35  05.73 ± 1.40  09.66 ± 1.09  0.031  7.10 ± 6.98  07.00 ± 3.56  05.20 ± 1.24  0.637
               ΔLVDs    11.75 ± 8.990  08.94 ± 1.68  15.07 ± 1.39  0.007  10.75 ± 8.610  12.00 ± 4.70  07.75 ± 1.48  0.397
               ΔLVDd%   11.52 ± 10.26  08.40 ± 1.94  14.55 ± 1.46  0.014  8.84 ± 9.10  10.96 ± 5.19  08.42 ± 1.96  0.651
               ΔLVDs%   20.81 ± 15.12  15.96 ± 2.85  26.98 ± 2.11  0.003  16.30 ± 13.08  22.80 ± 7.92  15.00 ± 2.69  0.361
                 OB:obese patients;Non⁃OB:non⁃obese patients. P values were derived from Student’s t⁃test after IPTW adjustment. The sample sizes presented
              are effective sample sizes after IPTW adjustment and therefore may be non⁃integers.

                                      表4 HFrEF/HFmrEF患者BMI与心脏结局相关性的回归分析
                     Table 4 Regression analyses of association between BMI and cardiac outcomes in HFrEF/HFmrEF patients
               Predictor                Unadjusted         Model 1            Model 2             Model 3
                     Outcome variable
               variable             β/OR(95% CI)  P    β/OR(95% CI)  P    β/OR(95% CI)  P    β/OR(95% CI)   P
               BMI   ΔLVEF         -0.28(-0.68-0.12) 0.171 -0.74(-1.25--0.23) 0.006 -0.74(-1.25--0.22) 0.006 -0.90(-1.49--0.32)  0.004
                     ΔLVDd         -0.11(-0.34-0.12) 0.361 -0.23(-0.54-0.08)  0.149 -0.36(-0.68--0.05) 0.028 -0.36(-0.73-0.01)  0.061
                     ΔLVDs         -0.14(-0.43-0.15) 0.353 -0.37(-0.75-0.01)  0.062 -0.46(-0.85--0.08) 0.022 -0.51(-0.95--0.06)  0.030
                     ΔLVDd%        -0.21(-0.54-0.12) 0.219 -0.39(-0.83-0.05)  0.086 -0.55(-1.02--0.08) 0.025 -0.57(-1.12--0.03))  0.043
                     ΔLVDs%        -0.31(-0.80-0.18) 0.218 -0.73(-1.37--0.09) 0.027 -0.84(-1.53--0.15) 0.019 -0.98(-1.77--0.19)  0.019
                     Treatment response -0.89(0.81-0.97)  0.008 -0.79(0.67-0.93)  0.005 -0.76(0.62-0.94)  0.011 -0.70(0.53-0.93)  0.013
                     [n(%)]
                 Model specifications:Model 1:adjusted for age and sex;Model 2:Model 1 plus baseline LVEF and left ventricular mass;Model 3:Model 2 plus co⁃
              morbidities(hypertension,coronary heart disease,atrial fibrillation,diabetes)and key GDMT medication doses(sacubitril/valsartan and metoprolol suc⁃
              cinate doses). β denotes regression coefficient for continuous outcomes;OR represents odds ratio for binary outcomes.

                                表5  LGE与ECV作为HFrEF/HFmrEF患者治疗反应预测因子的逻辑回归分析
                 Table 5  Logistic regression analysis of LGE and ECV as predictors of treatment response in HFrEF/HFmrEF patients
                 Predictor variable  Outcome variable  OR(95% CI)      P      Adjusted OR(95% CI)   Adjusted P
                 LGE              Treatment response  0.92(0.79-1.06)  0.257     0.68(0.49-0.95)      0.025
                 ECV                                 0.94(0.88-0.99)  0.023      0.89(0.81-0.97)      0.012
                 Adjusted variables:BMI,age,sex,baseline LVEF,left ventricular mass,and comorbidities(hypertension,coronary artery disease,atrial fibrillation,
              diabetes). OR,odds ratio;CI,confidence interval.

