Page 18 - 南京医科大学自然版
P. 18

第46卷第5期
              ·640 ·                             南 京    医 科 大 学 学         报                        2026年5月
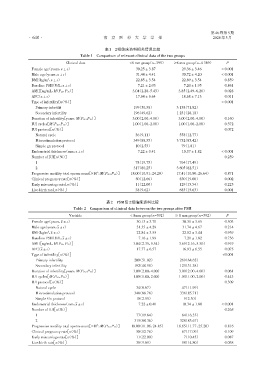

                                                 表1   2组临床资料相关情况比较
                                      Table 1 Comparison of relevant clinical data of the two groups
                               Clinical data                 <8 mm group(n=395)  ≥8 mm group(n=4 369)     P
                Female age(years,x ± s)                         30.25 ± 3.870        29.36 ± 3.460     < 0.001
                Male age(years,x ± s)                           31.44 ± 4.410        30.72 ± 4.200     < 0.001
                BMI(kg/m ,x ± s)                                22.85 ± 3.540        22.89 ± 3.540       0.859
                       2
                Baseline FSH(U/L,x ± s)                          7.21 ± 2.03          7.20 ± 1.95        0.861
                AMH[ng/mL,M(P25,P75)]                         3.04(2.28,5.43)0     3.85(2.49,6.26)0      0.028
                AFC(x ± s)                                      17.64 ± 6.640        18.68 ± 7.130       0.011
                Type of infertility[n(%)]                                                              < 0.001
                 Primary infertilit                            199(50.38)0000      3 138(71.82)00000.
                 Secondary infertility                         196(49.62)0000      1 231(28.18)00000.
                Duration of infertility[years,M(P25,P75)]     3.00(2.00,4.00)0     3.00(2.00,4.00)0      0.160
                IUI cycles[M(P25,P75)]                        1.00(1.00,2.00)0     1.00(1.00,2.00)0      0.372
                IUI protocol[n(%)]                                                                       0.072
                 Natural cycle                                  36(9.11)0000       0 558(12.77)00000.
                 Microstimulation protocol                     349(88.35)0000      3 732(85.42)00000.
                 Simple gn protocol                             10(2.53)0000       0 79(1.81)00000.
                Endometrial thickness(mm,x ± s)                  7.22 ± 0.41         10.37 ± 1.820     < 0.001
                Number of IUI[n(%)]                                                                      0.259
                 1                                             078(19.75)0000      0 764(17.49)00000.
                 2                                             317(80.25)0000      3 605(82.51)00000.
                Progressive motility total sperm count[×10 ,M(P25,P75)]  18.00(10.91,24.20)  17.41(10.80,26.64)  0.871
                                              6
                Clinical pregnancy rate[n(%)]                  050(12.66)0000      0 830(19.00)000.,0    0.002
                Early miscarriage rate[n(%)]                   011(22.00)0000      0 129(15.54)000.00    0.225
                Live birth rate[n(%)]                           38(9.62)0000       0 683(15.63)00000.    0.001


                                                  表2 PSM后2组临床资料比较
                                   Table 2 Comparison of clinical data between the two groups after PSM
                                 Variable                    < 8mm group(n=392)   ≥ 8 mm group(n=392)     P
                Female age(years,x ± s)                         30.13 ± 3.700        30.31 ± 3.650       0.503
                Male age(years,x ± s)                           31.35 ± 4.290        31.74 ± 4.670       0.214
                BMI(kg/m ,x ± s)                                22.84 ± 3.550        22.82 ± 3.440       0.939
                       2
                Baseline FSH(U/L,x ± s)                          7.16 ± 1.99          7.21 ± 1.82        0.736
                AMH[ng/mL,M(P25,P75)]                          3.04(2.35,5.54)0     3.69(2.16,5.50)0     0.919
                AFC(x ± s)                                      17.77 ± 6.570        16.93 ± 6.550       0.075
                Type of infertility[n(%)]                                                               <0.001
                 Primary infertility                           200(51.02)0000       269(68.62)0000
                 Secondary infertility                         192(48.98)0000       123(31.38)0000
                Duration of infertility[years,M(P25,P75)]      3.00(2.00,4.00)0     3.00(2.00,4.00)0     0.061
                IUI cycles[M(P25,P75)]                         1.00(1.00,2.00)0     1.00(1.00,2.00)0     0.443
                IUI protocol[n(%)]                                                                       0.309
                 Natural cycle                                  34(8.67)0000        047(11.99)0000
                 Microstimulation protocol                     348(88.78)0000       336(85.71)0000
                 Simple Gn protocol                             10(2.55)0000         09(2.30)0000
                Endometrial thickness(mm,x ± s)                  7.22 ± 0.40         10.34 ± 1.800     < 0.001
                Number of IUI[n(%)]                                                                      0.265
                 1                                             077(19.64)0000       064(16.33)0000
                 2                                             315(80.36)0000       328(83.67)0000
                Progressive motility total sperm count[×10 ,M(P25,P75)]  18.00(11.06,24.85)  18.65(11.77,25.20)  0.816
                                              6
                Clinical pregnancy rate[n(%)]                  050(12.76)0000       067(17.09)0000       0.109
                Early miscarriage rate[n(%)]                   011(22.00)0000       007(10.45)0000       0.087
                Live birth rate[n(%)]                           38(9.69)0000        058(14.80)0000       0.038
   13   14   15   16   17   18   19   20   21   22   23