Page 46 - 南京医科大学自然版
P. 46

第46卷第5期
              ·668 ·                             南 京    医 科 大 学 学         报                        2026年5月


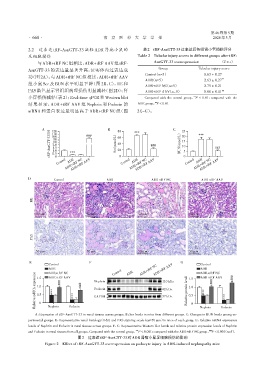
              2.2  过表达 tRF⁃AsnGTT⁃33 减轻 ADR 肾病小鼠的                  表2   tRF⁃AsnGTT⁃33过表达后各组肾小管损伤评分
              足细胞损伤                                              Table 2 Tubular injury scores in different groups after tRF⁃
                                                                        AsnGTT⁃33 overexpression       (x ± s)
                  与ADR+tRF NC组相比,ADR+tRF AAV 组tRF⁃
              AsnGTT⁃33 的表达量显著升高,证实体内过表达成                                 Group              Tubular injury score
                                                                    Control(n=5)               0.63 ± 0.27 ##
              功(图 2A);与 ADR+tRF NC 组相比,ADR+tRF AAV
                                                                    ADR(n=5)                   2.63 ± 0.27 **
              组小鼠 Scr 及 BUN 水平明显下降(图 2B、C),HE 和                     ADR+tRF NC(n=5)            2.75 ± 0.21 ##
              PAS染色显示肾组织病理损伤明显减轻(图2D);肾                             ADR+tRF AAV(n=5)           0.88 ± 0.41 ##

              小管损伤减轻(表2);Real⁃time qPCR和Western blot                Compared with the control group, P < 0.01;compared with the
                                                                                          **
              结果显示,ADR+tRF AAV 组 Nephrin 和 Podocin 的             ADR group,P < 0.01.
                                                                         ##
              mRNA 和蛋白表达量明显高于 ADR+tRF NC 组(图                    2E~G)。


                    A    120             ###       B           ***               C   20      ***
                        tRF⁃AsnGTT⁃33/U6  100  ***    (μmol/L) 80      ###          (mmol/L) 25 5   ###
                         110
                                                       60
                          90
                                                                                     15
                          80
                                                       40
                         2.0
                                                                                    BUN 10
                         1.5
                                                      Scr
                                                       20
                         1.0
                         0.5
                          0
                                  ADR+tRF AAV
                                ADR
                           Control ADR+tRF NC           0 Control ADR+tRF NC          0 Control ADR+tRF NC
                                                                                            ADR
                                                                                             ADR+tRF AAV
                                                              ADR
                                                                ADR+tRF AAV
              D
                          Control                 ADR                  ADR+tRF NC             ADR+tRF AAV
                HE
                  50 μm                  50 μm                   50 μm                  50 μm


                PAS


                  50 μm                  50 μm                   50 μm                  50 μm

               E                          F                                         G
                        Control                                                               Control
                                                                        ADR+tRF AAV
                        ADR                          Control  ADR  ADR+tRF NC           1.5   ADR          ###
                        ADR+tRF NC
                 Relative mRNA expression  1.0  ***  ###  ***  ###  GAPDH   110 kDa    Relative protein level  1.0  ***  ###  ***
                                                                                              ADR+tRF NC
                                                                                              ADR+tRF AAV
                        ADR+tRF AAV
                  1.5
                                             Nephrin
                                                                            42 kDa
                                             Podocin
                  0.5
                                                                                        0.5
                                                                            37 kDa
                   0
                                                                                         0
                                 Podocin
                       Ncphrin
                                                                                             Ncphrin
                                                                                                       Podocin
                 A:Expression of tRF⁃AsnGTT⁃33 in renal tissues across groups. B:Scr levels in mice from different groups. C:Changes in BUN levels among ex⁃
              perimental groups. D:Representative renal histology(H&E and PAS staining,scale bar=50 μm)in mice of each group. E:Relative mRNA expression
              levels of Nephrin and Podocin in renal tissues across groups. F,G:Representative Western blot bands and relative protein expression levels of Nephrin
                                                                                                  ###
                                                                ***
              and Podocin in renal tissues from all groups. Compared with the control group, P < 0.001;compared with the ADR+tRF NC group, P < 0.001(n=5).
                                     图2   过表达tRF⁃AsnGTT⁃33对ADR肾病小鼠足细胞损伤的影响
                      Figure 2  Effect of tRF⁃AsnGTT⁃33 overexpression on podocyte injury in ADR⁃induced nephropathy mice
   41   42   43   44   45   46   47   48   49   50   51