
Page 56 - 南京医科大学自然版
P. 56
第46卷第5期
·678 · 南 京 医 科 大 学 学 报 2026年5月
表3 吸气平台组和非吸气平台组的弥散功能及肺容量比较
Table 3 Comparison of diffusion function and lung capacity between the inspiratory plateau group and the non⁃inspiratory
plateau group
Inspiratory plateau group Non⁃inspiratory plateau
Characteristic t/Z P
(n=53) group(n=56)
DLCO%pred(%,x ± s) 56.30 ± 20.20 53.90 ± 20.22 -0.621 0.536
DLCO/VA%pred(%,x ± s) 67.53 ± 21.47 62.53 ± 22.78 -1.178 0.242
DLCOc%pred(%,x ± s) 56.79 ± 20.02 53.93 ± 20.21 -0.741 0.461
DLCOc/VA%pred(%,x ± s) 68.14 ± 21.26 62.58 ± 22.77 -1.316 0.191
FRC%pred[%,M(P25,P75 )] 94.20(79.90,109.80) 97.70(80.95,116.43) -0.991 0.322
RV/TLC%pred(%,x ± s) 126.70 ± 19.70 127.92 ± 16.85 0.349 0.727
RV%pred(%,x ± s) 112.82 ± 30.73 118.63 ± 26.55 1.056 0.293
TLC%pred[%,M(P25,P75 )] 83.50(75.75,92.60) 90.05(80.78,96.15) -2.080 0.038
VA%pred[%,M(P25,P75 )] 83.00(75.45,92.30) 89.65(80.45,96.03) -2.028 0.043
DLCOc%pred:diffusing capacity of the lung for carbon monoxide corrected as a percentage of predicted value;FRC%pred:functional residual
capacity as a percentage of predicted value;RV%pred:residual volume as a percentage of predicted value.
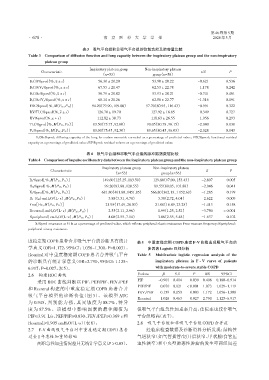
表4 吸气平台组和非吸气平台组的脉冲振荡数据比较
Table 4 Comparison of impulse oscillometry data between the inspiratory plateau group and the non⁃inspiratory plateau group
Inspiratory plateau group Non⁃inspiratory plateau
Characteristic Z P
(n=53) group(n=56)
R5%pred[%,M(P25,P75 )] 149.60(125.25,183.50) 129.80(97.00,153.43) -2.807 0.005
R20%pred[%,M(P25,P75 )] 99.20(83.80,120.55) 89.55(80.05,103.88) -2.046 0.041
X5%pred[%,M(P25,P75 )] 681.80(461.80,1451.85) 566.80(362.13,1 152.60) -1.285 0.199
R5-R20 [cmH2O/(L·s),M(P25,P75 )] 3.88(3.31,4.78) 3.38(2.72,4.04) -2.622 0.009
Fres[Hz,M(P25,P75 )] 21.95(17.49,28.03) 21.08(16.89,23.25) -1.413 0.158
Rcentral[cmH2O/(L·s),M(P25,P75 )] 2.55(2.11,2.96) 1.99(1.25,2.52) -3.750 <0.001
Rperipheral[cmH2O/(L·s),M(P25,P75 )] 4.08(2.55,7.14) 3.06(2.55,5.48) -1.637 0.102
X5%pred:reactance at 5 Hz as a percentage of predicted value,which reflects peripheral elastic resistance;Fres:resonant frequency;Rperipheral:
peripheral airway resistance.
度稳定期COPD患者合并吸气平台的诊断具有统计 表 5 中重度稳定期 COPD 患者 F⁃V 曲线出现吸气平台的
学意义(OR=1.172,95%CI:1.056~1.300,P=0.003)。 多因素Logistic回归分析
Rcentral 对中重度稳定期 COPD 患者合并吸气平台 Table 5 Multivariate logistic regression analysis of the
inspiratory plateau in F ⁃ V curve of patients
的诊断具有统计学意义(OR=2.790,95%CI:1.125~
6.917,P=0.027,表5)。 with moderate⁃to⁃severe stable COPD
2.6 构建ROC曲线 Variate β S.E P OR 95%CI
PIF -0.901 0.414 0.030 0.406 0.180-0.914
采用 ROC 曲线判断以 PIF、PEF/PIF、FEV1/PEF
PEF/PIF 0.070 0.021 <0.001 1.073 1.029-1.119
和 Rcentral 构建的中重度稳定期 COPD 患者合并
FEV1/PEF 0.159 0.053 0.003 1.172 1.056-1.300
吸气平台模型的诊断价值(图 3)。该模型 AUC
Rcentral 1.026 0.463 0.027 2.790 1.125-6.917
为 0.945,判别能力强,其灵敏度为 88.7%,特异
度 为 87.5%。该模型中影响因素的最佳阈值为 但吸气平台组急性加重率升高,住院率也较非吸气
PIF≤3.91 L/s、PEF/PIF≥0.830、FEV1/PEF≥0.369 s 和 平台组略高(表7)。
Rcentral≥1.905 cmH2O/(L·s)(表6)。 2.8 吸气平台组和非吸气平台组COPD合并症
2.7 F⁃V曲线吸气平台对中重度稳定期COPD患者 经临床检查数据及诊断资料分析发现:结构性
过去1年急性加重的影响 气道狭窄(如气管插管/切开后狭窄、甲状腺/食管压
两组急性加重情况差异无统计学意义(P > 0.05), 迫性狭窄)和中央型肺恶性肿瘤的发生率两组间差