Page 54 - 南京医科大学自然版
P. 54

第46卷第5期
              ·676 ·                             南 京    医 科 大 学 学         报                        2026年5月


                                                                归分析 F⁃V 曲线吸气平台的相关因素,构建诊断中
                                          F/Vex
                  10                                            重度稳定期 COPD 患者合并吸气平台的模型,用
                                                                Hosmer⁃Lemeshow 检验进行校正,用受试者工作特
                   5                                    B
                 (L/s)  0                               1       征(receiver operating characteristic,ROC)曲线的曲
                 Flow                                   2 3     线下面积(area under the curve,AUC)进行判别。卡
                   5                                            方检验初步探索中重度稳定期COPD患者合并吸气
                              2
                                                                平台与各类疾病的关系。P < 0.05为差异有统计学
                  10
                                                                意义。
                                          F/Vin
                                                                2 结     果
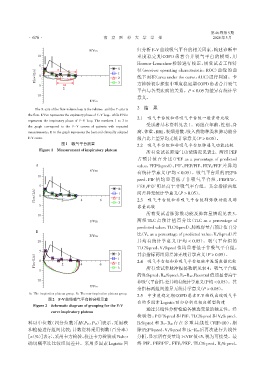
                 The X⁃axis of the flow⁃volume loop is the volume,and the Y⁃axis is
              the flow. F/Vex represents the expiratory phase of F⁃V loop,while F/Vin
                                                                2.1  吸气平台组和非吸气平台组一般资料比较
              represents the inspiratory phase of F⁃V loop. The numbers 1 to 3 in
                                                                     受试者基本资料见表1。两组在年龄、性别、身
              the graph correspond to the F ⁃ V curves of patients with repeated
              measurements;B in the graph represents the best and clinically adopted  高、体重、BMI、吸烟指数、吸入药物种类和肺功能分
              F⁃V curve.                                        级占比上差异均无统计学意义(P > 0.05)。
                             图1 吸气平台测量                               吸气平台组和非吸气平台组肺通气功能比较
                                                                2.2
                   Figure 1 Measurement of inspiratory plateau
                                                                     所有受试者肺通气功能情况见表 2。两组 PEF
                                                                占预计值百分比(PEF as a percentage of predicted
                  A                                             value,PEF%pred)、PIF、PEF/PIF、FEV1/PEF 差异均
                                          F/Vex
                                                                有统计学意义(P 均 < 0.05)。吸气平台组的 PEF%
                  10
                                                                pred、PIF 值均显著低于非吸气平台组,PEF/PIF、
                   5                                    B       FEV1/PEF 明显高于非吸气平台组。其余指标两组
                 (L/s)  0                               1       间差异无统计学意义(P > 0.05)。
                 Flow         2       4        6        2       2.3  吸气平台组和非吸气平台组肺弥散功能及肺
                                                        3
                   5                                            容量比较
                                                                     所有受试者肺弥散功能及肺容量情况见表 3。
                  10
                                          F/Vin                 两组 TLC 占预计值百分比(TLC as a percentage of
                                                                predicted value,TLC%pred)、肺泡容量占预计值百分
                  B                                             比(VA as a percentage of predicted value,VA%pred)差
                                          F/Vex
                  10                                            异均有统计学意义(P 均 < 0.05)。吸气平台组的
                                                                TLC%pred、VA%pred 值均显著低于非吸气平台组。
                   5                                   B        其余指标两组间差异无统计学意义(P > 0.05)。
                 (L/s)  0                              1        2.4 吸气平台组和非吸气平台组脉冲振荡数据比较
                 Flow         2       4        6       2 3           所有受试者脉冲振荡数据见表4。吸气平台组

                   5
                                                                的R5%pred、R20%pred、R5-R20、Rcentral值均显著高于
                  10                                            非吸气平台组,差异均有统计学意义(P均 < 0.05)。其
                                          F/Vin
                                                                余指标两组间差异无统计学意义(P > 0.05)。
              A:The inspiration plateau group. B:The non⁃inspiration plateau group.  2.5  中重度稳定期COPD患者F⁃V曲线出现吸气平
                       图2   F⁃V曲线吸气平台的分组示意
                Figure 2  Schematic diagram of grouping for the F⁃V  台的多因素Logistic回归分析及相应模型构建
                         curve inspiratory plateau                   通过共线性分析检验各候选变量的独立性。经
                                                                检验得:PEF%pred 和 PIF、TLC%pred 和 VA%pred、
              料以中位数(四分位数)[M(P25,P75)]表示,采用秩                     R5%pred 和 R5-R20 存在多重共线性(VIF>10),剔
              和检验进行组间比较;计数资料采用例数(百分率)                           除 PEF%pred、VA%pred 和 R5-R20后再次进行共线性

             [n(%)]表示,采用卡方检验、校正卡方检验或Fisher                      分析,显示所有变量均1<VIF值<5,视为可接受。最
              确切概率法比较组间差异。采用多因素 Logistic 回                      终 PIF、PEF/PIF、FEV1/PEF、TLC% pred、R5% pred、
   49   50   51   52   53   54   55   56   57   58   59