
Page 74 - 南京医科大学自然版
P. 74
第46卷第5期
·696 · 南 京 医 科 大 学 学 报 2026年5月
其他原因(n=5)。SPSS 组与 Non⁃EGV⁃SPSS 组死亡 P=0.012)是影响 TIPS 术后生存的独立危险因素
率分别为 29.1%和 36.2%,差异无统计学意义(P= (表6)。
0.400,表2)。进一步分析显示,两组在术后1、3、6、
3 讨 论
12、24 个月的累积死亡发生率均无显著差异(表
3)。Kaplan⁃Meier 生存分析提示,两组术后死亡率 本研究结果表明,在肝硬化患者中,首次 TIPS
无显著差异(P=0.427,图 2C)。Logistic 回归分析提 手术联合栓塞时合并Non⁃EGV⁃SPSS 与更高的再出
示年龄(HR=1.025,95%CI:1.002~1.047,P=0.030)和 血风险相关,但对TIPS术后OHE发生率和死亡率无
血清总胆红素水平(HR=1.002,95%CI:1.000~1.005, 显著影响。
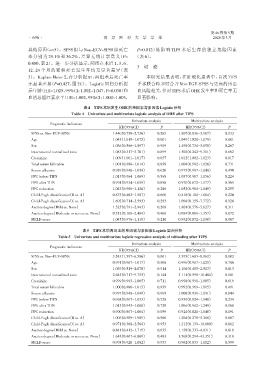
表4 TIPS术后发生OHE的单因素与多因素Logistic分析
Table 4 Univariate and multivariate logistic analysis of OHE after TIPS
Univariate analysis Multivariate analysis
Prognostic indicators
HR(95%CI) P HR(95%CI) P
SPSS vs. Non⁃EGV⁃SPSS 1.440(0.758-2.736) 0.265 1.807(0.836-3.907) 0.133
Age 1.045(1.019-1.072) 0.001 1.049(1.020-1.079) 0.001
Sex 1.036(0.566-1.897) 0.909 1.498(0.734-3.058) 0.267
International normalized ratio 1.083(0.317-3.701) 0.899 1.502(0.242-9.311) 0.662
Creatinine 1.009(1.001-1.017) 0.037 1.012(1.002-1.023) 0.017
Total serum bilirubin 1.001(0.988-1.014) 0.858 1.004(0.982-1.026) 0.731
Serum albumin 0.989(0.946-1.034) 0.620 0.975(0.907-1.048) 0.490
PPG before TIPS 1.015(0.964-1.069) 0.568 1.057(0.967-1.156) 0.224
PPG after TIPS 0.994(0.934-1.059) 0.858 0.970(0.872-1.077) 0.565
PPG reduction 1.043(0.966-1.126) 0.286 1.052(0.964-1.149) 0.255
Child⁃Pugh classification(B vs. A) 0.875(0.482-1.587) 0.660 0.418(0.104-1.684) 0.220
Child⁃Pugh classification(C vs. A) 1.602(0.714-3.593) 0.253 1.098(0.155-7.772) 0.926
Ascites degree(Mild vs. None) 1.525(0.791-2.943) 0.208 1.801(0.576-5.627) 0.311
Ascites degree(Moderate or severe vs. None) 0.512(0.106-2.484) 0.406 0.034(0.001-1.357) 0.072
MELD score 1.045(0.976-1.119) 0.210 0.992(0.872-1.130) 0.907
表5 TIPS术后再出血的单因素与多因素Logistic回归分析
Table 5 Univariate and multivariate logistic regression analysis of rebleeding after TIPS
Univariate analysis Multivariate analysis
Prognostic indicators
HR(95%CI) P HR(95%CI) P
SPSS vs. Non⁃EGV⁃SPSS 3.243(1.597-6.586) 0.001 3.595(1.603-8.062) 0.002
Age 0.991(0.967-1.017) 0.506 0.996(0.967-1.025) 0.786
Sex 1.039(0.519-2.078) 0.914 1.104(0.485-2.513) 0.813
International normalized ratio 2.645(0.717-9.755) 0.144 3.111(0.590-16.404) 0.181
Creatinine 0.999(0.993-1.005) 0.711 0.998(0.991-1.005) 0.619
Total serum bilirubin 1.000(0.986-1.015) 0.959 0.992(0.969-1.015) 0.491
Serum albumin 0.997(0.948-1.049) 0.909 1.008(0.931-1.091) 0.844
PPG before TIPS 0.968(0.907-1.033) 0.328 0.930(0.824-1.048) 0.234
PPG after TIPS 1.013(0.943-1.088) 0.729 1.096(0.962-1.249) 0.168
PPG reduction 0.900(0.807-1.004) 0.059 0.924(0.821-1.040) 0.191
Child⁃Pugh classification(B vs. A) 1.006(0.509-1.989) 0.986 1.204(0.270-5.368) 0.807
Child⁃Pugh classification(C vs. A) 0.971(0.368-2.564) 0.953 1.212(0.139-10.600) 0.862
Ascites degree(Mild vs. None) 0.841(0.412-1.719) 0.635 1.158(0.333-4.031) 0.818
Ascites degree(Moderate or severe vs. None) 1.648(0.407-6.669) 0.483 3.568(0.294-43.351) 0.318
MELD score 0.998(0.920-1.082) 0.953 0.962(0.833-1.112) 0.599