


Page 66 - 南京医科大学自然版
P. 66
第46卷第6期
               ·848  ·                           南 京    医 科 大 学 学         报                        2026年6月


              A                                B                                C
                                                                                              T1D⁃related and
                           All⁃cause mortality     9.0     All⁃cause mortality      140  complication⁃related mortality
                  (95%CI)  5.0  P for overall<0.001  (95%CI)  8.0  P for overall<0.001  (95%CI)  120  P for overall<0.001
                  6.0
                                                                                        P for non⁃linearity=0.117
                                                       P for non⁃linearity=0.099
                      P for non⁃linearity=0.179
                                                   7.0
                                                                                    100
                  4.0
                                                   6.0
                                                                                     80
                                                   5.0
                  Hazard ration  3.0               Hazard ration  4.0              Hazard ration  60
                                                   3.0
                  2.0
                                                                                     40
                                                   2.0
                  1.0
                    0                              1.0 0                             20 0
                     0     1    2     3     4        00  0.1  0.2  0.3  0.4  0.5       0     1    2     3     4
                                PF                               FI                               PF
              D             T1D⁃related and    E                                F
                        complication⁃related mortality  6.0  Macrovascular complications  14.0  Macrovascular complications
                  (95%CI)  14.0  P for overall<0.001  (95%CI)  5.0  P for overall<0.001  (95%CI)  12.0  P for overall<0.001
                  16.0
                       P for non⁃linearity=0.351
                                                                                        P for non⁃linearity=0.968
                                                       P for non⁃linearity=0.624
                  12.0
                                                                                    10.0
                                                   4.0
                  Hazard ration 10.0               Hazard ration  3.0              Hazard ration  6.0
                                                                                     8.0
                   8.0
                   6.0
                                                   2.0
                                                                                     4.0
                   4.0
                                                   1.0
                   2.0
                    0                                0                               2.0 0
                     00   0.1  0.2  0.3  0.4  0.5     0     1    2     3     4        00   0.1  0.2  0.3  0.4  0.5
                                 FI                              PF                               FI
                               G    4.0  Microvascular complications  H  6.0  Microvascular complications
                                   (95%CI)  3.0  P for overall<0.001  (95%CI)  5.0  P for overall<0.001
                                                                        P for non⁃linearity=0.234
                                        P for non⁃linearity=0.009
                                                                    4.0
                                   Hazard ration  2.0              Hazard ration  3.0
                                                                    2.0
                                    1.0
                                                                    1.0
                                     0                               0
                                      0     1     2    3     4        00  0.1  0.2  0.3  0.4  0.5
                                                 PF                               FI
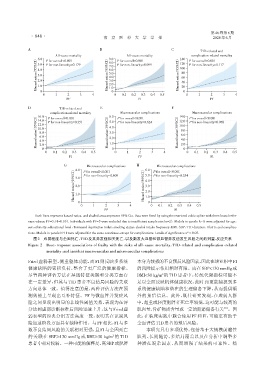
                 Dark lines represent hazard ratios,and shaded areas represent 95% CIs. Data were fitted by using the restricted cubic spline with three knots(refer⁃
              ence values:PF=0,FI=0.10). Individuals with PF=5 were excluded due to insufficient sample size(n=2). Models in panels A-D were adjusted for age,
              sex,ethnicity,educational level,Townsend deprivation index,smoking status,alcohol intake frequency,BMI,SBP,T1D duration,HbA1c and complica⁃
              tions. Models in panels E-H were adjusted for the same covariates,except for complications. Levels of significance:P < 0.05.
                图2 虚弱程度与全因死亡、T1D及其并发症相关死亡,以及新发大血管和微血管并发症发生风险之间的剂量⁃反应关系
              Figure 2  Dose⁃response associations of frailty with the risks of all⁃cause mortality,T1D⁃related and complication⁃related
                      mortality,and incident macrovascular and microvascular complications
              Fried 虚弱表型,侧重躯体功能,而 FI 则反映多系统                     本身为较强的不良预后风险因素,因此在该亚组中FI
              健康缺陷的累积负荷,整合了更广泛的健康指标。                            的风险提示作用相对有限。而在SBP<130 mmHg或
              尽管两种评估方法在基线特征关联和分类方面存                             BMI<30 kg/m 的 T1D 患者中,传统代谢指标可能不
                                                                            2
              在一定差异,但其与T1D患者不良结局风险的关联                           足以全面反映机体健康状况,此时FI更能捕捉到多
              方向总体一致。值得注意的是,两种评估方法在预                            系统健康缺陷和潜在的生理储备下降,从而提供额
              测效能上呈现出互补特征。PF 与微血管并发症风                           外的预后信息。此外,既往研究发现,在虚弱人群
              险之间呈现出明显的非线性阈值关系,表现为在评                            中,超重或轻度肥胖者死亡率较低,这可能与较高的
              分达到虚弱诊断标准后风险迅速上升,这与Fried虚                         肌肉量、骨矿物质含量或一定的脂肪储备有关 。因
                                                                                                        [31]
              弱表型的经典分组方法高度一致,表明其在识别风                            此,在临床实践中联合使用 PF 和 FI,可能更有助于
              险加速阶段方面具有独特作用。与PF相比,FI与多                          全面评估T1D患者的预后风险。
              数不良结局风险的关联相对更强,且FI与全因死亡                                本研究具有多项优势,包括基于大规模前瞻性
                                                     2
              的关联在 SBP≥130 mmHg 或 BMI≥30 kg/m 的 T1D             队列、长期随访、多结局覆盖以及在分析中调整多
              患者中相对较弱。一种可能的解释是,高SBP或肥胖                          种潜在混杂因素,从而增强了结果的可靠性。然

