


Page 134 - 南京医科大学自然版
P. 134
第46卷第7期
               ·1080 ·                           南 京    医 科 大 学 学         报                        2026年7月


                       A                                          B
                           1.00                                       1.00
                                Training AUC=0.811                         Training AUC=0.737
                                Validation AUC=0.817                       Validation AUC=0.720
                           0.75                                       0.75
                          Sensitivity  0.50                          Sensitivity  0.50


                           0.25                                       0.25
                                                  Training                                   Training
                                                  Validation                                 Validation
                             0                                          0
                              0.0   0.25   0.50  0.75   1.00              0    0.25   0.50  0.75   1.00
                                        1-Specificity                              1-Specificity

                                            C
                                                1.00
                                                     Training AUC=0.755
                                                     Validation AUC=0.788
                                                0.75
                                                Sensitivity  0.50


                                                0.25
                                                                        Training
                                                                        Validation
                                                  0
                                                     0    0.25  0.50   0.75   1.00
                                                              1-Specificity
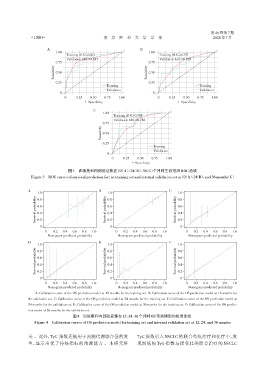
                                 图3 训练集和内部验证集在12(A)、24(B)、36(C)个月时生存预测ROC曲线
               Figure 3 ROC curves of survival prediction for the training set and internal validation set at 12(A),24(B),and 36 months(C)


              A                                B                               C
                  1.0                              1.0                             1.0
                 Survival probability  0.6        Survival probability  0.6       Survival probability  0.6
                                                   0.8
                  0.8
                                                                                   0.8
                                                                                   0.4
                  0.4
                                                   0.4
                  0.2
                   0                               0.2 0                           0.2 0
                     00   0.2  0.4  0.6  0.8  1.0     00  0.2  0.4  0.6  0.8  1.0     00  0.2  0.4  0.6  0.8  1.0
                       Nomogram⁃predicted probability   Nomogram⁃predicted probability  Nomogram⁃predicted probability
              D                                E                               F
                  1.0                              1.0                             1.0
                 Survival probability  0.6        Survival probability  0.6       Survival probability  0.6
                  0.8
                                                                                   0.8
                                                   0.8
                                                                                   0.4
                                                   0.4
                  0.4
                  0.2
                   0                               0.2 0                           0.2 0
                     00   0.2  0.4  0.6  0.8  1.0     00  0.2  0.4  0.6  0.8  1.0     00  0.2  0.4  0.6  0.8  1.0
                       Nomogram⁃predicted probability   Nomogram⁃predicted probability  Nomogram⁃predicted probability
                 A:Calibration curve of the OS prediction model at 12 months for the training set. B:Calibration curve of the OS prediction model at 12 months for
              the validation set. C:Calibration curve of the OS prediction model at 24 months for the training set. D:Calibration curve of the OS prediction model at
              24 months for the validation set. E:Calibration curve of the OS prediction model at 36 months for the training set. F:Calibration curve of the OS predic⁃
              tion model at 36 months for the validation set.
                                   图4  训练集和内部验证集在12、24、36个月时OS预测模型的校准曲线
                 Figure 4  Calibration curves of OS prediction model for training set and internal validation set at 12,24,and 36 months


              关 。此外,TyG 指数还被用于预测代谢综合征的发                         TyG 指数引入 NSCLC 的联合免疫治疗和化疗中,发
              生,显示出优于传统指标的预测能力 。本研究将                            现较低的 TyG 指数与接受此类联合治疗的 NSCLC

