
Page 64 - 南京医科大学学报自然科学版
P. 64
第44卷第2期
·202 · 南 京 医 科 大 学 学 报 2024年2月
Gap junction n=2(1.34E⁃03) C
Sphingolipid signaling pathway n=2(2.53E⁃03)
Ras signaling pathway n=2(5.19E⁃04)
Rap1 signaling pathway n=2(2.49E⁃04)
Phospholipase D signaling pathway n=2(1.34E⁃03)
Neuroactive ligand⁃receptor interaction n=3(2.20E⁃03) E
cAMP signalin pathway n=2(7.01E⁃03)
Calcium signalin pathway n=2(1.34E⁃03)
Apelin signalin pathway n=2(8.84E⁃04)
Prosteat cancer n=2(1.34E⁃03)
Pathways in cancer n=3(4.80E⁃04)
Endocrine resistance n=2(2.49E⁃04) H
EGFR tyrosine kinase inhibitor resistance n=1(1.02E⁃02) Top Classification
Chemical carcinogenesis⁃receptor activation n=2(9.37E⁃03) C:Cellular Processes
Sphingolipid metabolism n=2(7.01E⁃03) E:Environmental Information Processing
H:Human Diseases
Purine metabolism n=3(1.19E⁃02) M:Metabolism
Biosynthesis of amino acids n=5(3.83E⁃04) M O:Organismal Systems
Alanine,aspartate and glutamate metabolism n=2(8.75E⁃03)
Thyroid hormone synthesis n=2(4.97E⁃03)
Thyroid hormone signaling pathway n=2(1.34E⁃03)
Thermogenesis n=2(5.95E⁃03)
Protein digestion and absorption n=3(1.64E⁃03)
Prolactin signaling pathway n=2(1.34E⁃03)
Ovarian steroidogenesis n=2(6.47E⁃03)
GnRH secretion n=2(8.84E⁃04) O
Glutamatergic synapse n=2(6.90E⁃04)
Fc gamma R⁃mediated phagocytosis n=2(6.90E⁃04)
Estrogen signaling pathway n=2(6.90E⁃04)
Endocrine and other factor⁃regulated calcium reabsorption n=2(6.90E⁃04)
Bile secretion n=4(1.31E⁃03)
0 1 2 3 4 5
⁃Lg(ρ)
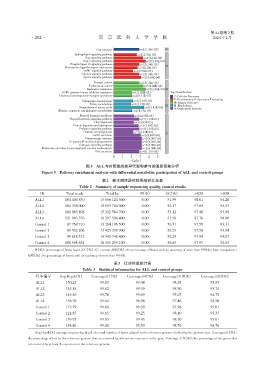
图5 ALL与对照组的差异代谢物参与的通路富集分析
Figure 5 Pathway enrichment analysis with differential metabolite participation of ALL and control groups
表2 样本测序质控结果统计汇总表
Table 2 Summary of sample sequencing quality control results
ID Total reads Total bp N(%) GC(%) >Q20 >Q30
ALL1 104 440 830 15 666 124 500 0.00 51.99 98.01 94.20
ALL2 104 358 000 15 653 700 000 0.00 52.17 97.69 93.53
ALL3 102 083 898 15 312 584 700 0.00 53.12 97.88 93.98
ALL4 121 983 376 18 297 506 400 0.00 53.58 97.76 94.00
Control 1 87 760 710 13 164 106 500 0.00 50.91 97.59 93.31
Control 2 89 502 206 13 425 330 900 0.00 50.55 97.90 93.94
Control 3 99 618 312 14 942 746 800 0.00 52.23 97.94 94.07
Control 4 108 968 634 16 345 295 100 0.00 50.65 97.97 94.09
N(%):percentage of fuzzy bases;GC(%):GC content;Q20(%):the percentage of bases with an accuracy of more than 99% for base recognition;
Q30(%):the percentage of bases with an accuracy of more than 99.9%.
表3 比对信息统计表
Table 3 Statisical information for ALL and control groups
样本编号 Avg.Depth(X) Coverage≥1(%) Coverage≥4(%) Coverage≥10(%) Coverage≥20(%)
ALL1 150.23 99.83 99.44 98.38 95.93
ALL2 145.18 99.82 99.39 98.30 95.74
ALL3 149.36 99.70 99.09 97.67 94.73
ALL4 158.76 99.64 98.96 97.46 94.50
Control 1 119.79 99.64 99.20 97.98 95.01
Control 2 122.85 99.65 99.25 98.10 95.35
Control 3 139.95 99.83 99.43 98.30 95.61
Control 4 148.86 99.88 99.59 98.76 96.76
Avg.Depth(X):average sequencing depth,the total number of bases aligned to the reference genome divided by the genome size. Coverage≥1(%):
the percentage of loci in the reference genome that are covered by at least one sequence to the gene. Coverage ≥ X(%):the percentage of the genes that
are covered by at least X sequences in the reference genome.